Advertisements
Advertisements
Question
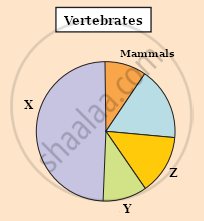
Given below is a 'pie chart' representing the global biodiversity:
Proportionate number of species of major taxa.

- Identify (X) and (Y) in the given 'pie chart'.
- "Extinction of species across taxa are not random." Which group amongst the vertebrates is more vulnerable to extinction?
- Give one example of each of the recent extinctions of species in Russia, Mauritius and Australia.
Solution
- The relative number of species of the main taxa of vertebrates is shown in the pie chart. In this instance, X stands for fish and Y for amphibians.
- Among the vertebrates, amphibians are more vulnerable to extinction.
- Some examples of recent extinctions include the dodo (Mauritius), thylacine (Australia), and Steller’s Sea Cow (Russia).
RELATED QUESTIONS
How do ecologists estimate the total number of species present in the world?
Which of the following is not an invasive alien species in the Indian context?
Where among the following will you find pitcher plant?
What is common to the following plants nepenthes, psilotum, Rauwolfia and acontium?
Which one of the following is an endangered plant species of India?
What is the expanded form of IUCN?
Why are the conventional methods not suitable for the assessment of biodiversity of bacteria?
What could be the possible explanation for greater vulnerability of amphibians to extinction as compared to other animal groups?
How do scientists extrapolate the total number of species on Earth?
Give three reasons as to why the prokaryotes are not given any figures for their diversity by ecologists.
