Advertisements
Advertisements
प्रश्न
A graph that displays data that changes continuously over the periods of time is _________
उत्तर
A graph that displays data that changes continuously over the periods of time is Histogram
APPEARS IN
संबंधित प्रश्न
Given below is the frequency distribution of driving speeds (in km/hour) of the vehicles of 400 college students:
| Speed (in km/hr) | No. of Students |
| 20-30 | 6 |
| 30-40 | 80 |
| 40-50 | 156 |
| 50-60 | 98 |
60-70 |
60 |
Draw Histogram and hence the frequency polygon for the above data.
The following is the frequency distribution of waiting time at ATM centre; draw histogram to represent the data:
| Waiting time (in seconds) |
Number of Customers |
| 0 -30 | 15 |
| 30 - 60 | 23 |
| 60 - 90 | 64 |
| 90 - 120 | 50 |
| 120 - 150 | 5 |
Draw a histogram of the following data.
| Height of student (cm) | 135 - 140 | 140 - 145 | 145 - 150 | 150 - 155 |
| No. of students | 4 | 12 | 16 | 8 |
| Result (Percentage) | 30 - 40 | 40 - 50 | 50 - 60 | 60 -70 | 70 - 80 | 80 - 90 | 90 - 100 |
| No. of students | 7 | 33 | 45 | 65 | 47 | 18 | 5 |
Given below is the frequency distribution of the heights of 50 students of a class:
| Class interval: | 140−145 | 145−150 | 150−155 | 155−160 | 160−165 |
| Frequency: | 8 | 12 | 18 | 10 | 5 |
Draw a histogram representing the above data.
Construct a histogram for the following data:
| Monthly school fee (in Rs): | 30−60 | 60−90 | 90−120 | 120−150 | 150−180 | 180−210 | 210−240 |
| Number of schools: | 5 | 12 | 14 | 18 | 10 | 9 | 4 |
Construct histograms for following frequency distribution:
| Class Mark | 15 | 25 | 35 | 45 | 50 | 55 | 60 |
| Frenuencv | 6 | 12 | 15 | 18 | 25 | 14 | 10 |
Represent the following data by histogram:
| Price of sugar Per kg (in Rs) | Number of weeks |
| 28-30 | 4 |
| 30-32 | 8 |
| 32-34 | 22 |
| 34-36 | 12 |
| 36-38 | 6 |
The graphical representation of grouped data is _________
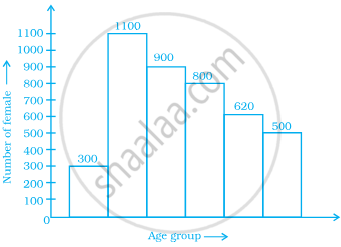
The below histogram shows the number of literate females in the age group of 10 to 40 years in a town.

- Write the classes assuming all the classes are of equal width.
- What is the classes width?
- In which age group are literate females the least?
- In which age group is the number of literate females the highest?
