Advertisements
Advertisements
प्रश्न
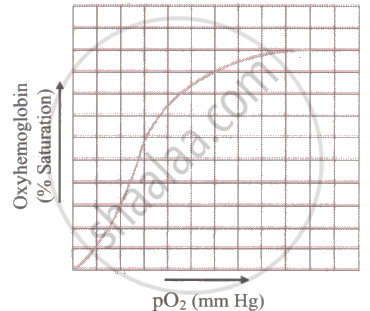
A sigmoid curve is obtained when the percentage saturation of haemoglobin (Hb) with oxygen is plotted against the \[\ce{PO2}\] as indicated below:

विकल्प
The curve shifts to the right side due to an increased affinity of \[\ce{O2}\] with haemoglobin.
Curve shifts to the left side due to increased affinity of \[\ce{O2}\] with haemoglobin.
The curve will not shift either to the left or right.
The curve becomes a straight line instead of a sigmoidal.
उत्तर
Curve shifts to the left side due to increased affinity of \[\ce{O2}\] with haemoglobin.
Explanation:
Reduced oxygen affinity for haemoglobin is indicated by a right-side shift of the oxygen dissociation curve. As a result, the curve swings to the right and the per cent saturation of haemoglobin with oxygen decreases.
