Advertisements
Advertisements
प्रश्न
Comparison of parts of a whole may be done by a pie chart
विकल्प
True
False
उत्तर
Comparison of parts of a whole may be done by a pie chart - True
APPEARS IN
संबंधित प्रश्न
Pie chart is a __________ graph
A pie diagram is a circle broken down into component sectors
A paint company asked a group of students about their favourite colours and made a pie chart of their findings. Use the information to answer the following questions.
What percentage of the students like red colour?
A paint company asked a group of students about their favourite colours and made a pie chart of their findings. Use the information to answer the following questions.
How many students liked green colour?
A paint company asked a group of students about their favourite colours and made a pie chart of their findings. Use the information to answer the following questions.
What fraction of the students liked blue?
A paint company asked a group of students about their favourite colours and made a pie chart of their findings. Use the information to answer the following questions.
How many students were asked about their favourite colours?
A survey gives the following information of food items preferred by people. Draw a Pie chart.
| Items | Vegetables | Meat | Salad | Fruits | Sprouts | Bread |
| No. of people | 160 | 90 | 80 | 50 | 30 | 40 |
Monthly expenditure of Kumaran’s family is given below. Draw a suitable Pie chart.
| Particulars | Food | Education | Rent | Transport | Miscellaneous |
| Expenses (in %) | 50% | 20% | 15% | 5% | 10% |
Also
1. Find the amount spent for education if Kumaran spends ₹ 6000 for Rent.
2. What is the total salary of Kumaran?
3. How much did he spend more for food than education?
The following table shows the percentage of demand of different plants.
| Plants | Rose | Lily | Tulip | Daisy | Dahlia |
| No. of Plants | 31 | 25 | 12 | 17 | 15 |
Complete the following table:
| Plants | No. of plants | Measure of central angle |
| Rose | 31 | `31/100 xx 360^circ = square` |
| Lily | 25 | `square` |
| Tulip | 12 | `square` |
| Daisy | 17 | `square` |
| Dahlia | 15 | `square` |
In the given figure, the pie diagram represents the amount spent on different sports by a school administration in a year. If the money spent on football is ₹ 9,000, answer the following questions:
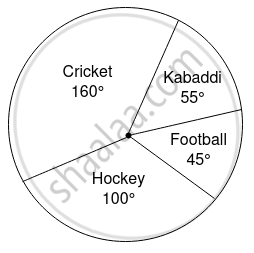
- What is the total amount spent on sports?
- What is the amount spent on cricket?
