Advertisements
Advertisements
प्रश्न
Define the following term:
Frequency distribution
उत्तर
Frequency distribution is the organisation of raw data in table form with classes and frequencies.
APPEARS IN
संबंधित प्रश्न
Organise the following marks in a class assessment, in a tabular form.
4, 6, 7, 5, 3, 5, 4, 5, 2, 6, 2, 5, 1, 9, 6, 5, 8, 4, 6, 7
- Which number is the highest?
- Which number is the lowest?
- What is the range of the data?
- Find the arithmetic mean.
Prepare a frequency table of the following scores obtained by 50 students in a test:
| 42, | 51, | 21, | 42, | 37, | 37, | 42, | 49, | 38, | 52, | 7, | 33, | 17, |
| 44, | 39, | 7, | 14, | 27, | 39, | 42, | 42, | 62, | 37, | 39, | 67, | 51, |
| 53, | 53, | 59, | 41, | 29, | 38, | 27, | 31, | 64, | 19, | 53, | 51, | 22, |
| 61, | 42, | 39, | 59, | 47, | 33, | 34, | 16, | 37, | 57, | 43, |
Construct a frequency distribution table for the following marks obtained by 25 students in a history test in class VIII of a school:
9, 17, 12, 20, 9, 18, 25, 17, 19, 9, 12, 9, 12, 18, 17, 19, 20, 25, 9, 12, 17, 19, 19, 20, 9
(i) What is the range of marks?
(ii) What is the highest mark?
(iii) Which mark is occurring more frequently?
The monthly wages of 30 workers in a factory are given below:
830, 835, 890, 810, 835, 836, 869, 845, 898, 890, 820, 860, 832, 833, 855, 845, 804, 808, 812, 840, 885, 835, 836, 878, 840, 868, 890, 806, 840, 890.
Represent the data in the form of a frequency distribution with class size 10.
The tally marks for number 8 in standard form is ______________
The tally marks |||| |||| represents the number count
The heights (in centimeters) of 40 children are.
| 110 | 112 | 112 | 116 | 119 | 111 | 113 | 115 | 118 | 120 |
| 110 | 113 | 114 | 111 | 114 | 113 | 110 | 120 | 118 | 115 |
| 112 | 110 | 116 | 111 | 115 | 120 | 113 | 111 | 113 | 120 |
| 115 | 111 | 116 | 112 | 110 | 111 | 120 | 111 | 120 | 111 |
Prepare a tally marks table
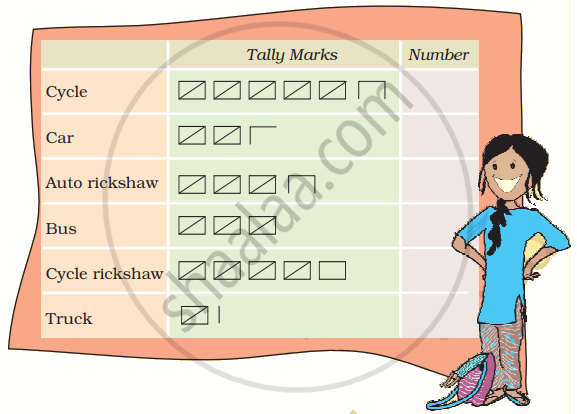
Sumita stood on the road for half an hour and counted the number of vehicles passing by. She made a tally mark for each vehicle. This helped her in counting the total number of vehicles in each group.

- Write the number of each vehicle in the table.
- How many vehicles in all did Sumita see on the road in half an hour?
- Auto rickshaws are thrice the number of trucks — true/false?
- Make tally marks for 7 more buses and 2 more trucks.
An observation occurring five times in a data is recorded as | | | | |, using tally marks.
The lengths in centimetres (to the nearest centimetre) of 30 carrots are given as follows:
15, 22, 21, 20, 22,15, 15, 20, 20,15, 20, 18, 20, 22, 21,
20, 21, 18, 21, 18, 20, 18, 21, 18, 22, 20, 15, 21, 18, 20
Arrange the data given above in a table using tally marks and answer the following questions.
(a) What is the number of carrots which have length more than 20 cm?
(b) Which length of the carrots occur maximum number of times? Minimum number of times?
