Advertisements
Advertisements
प्रश्न
उत्तर
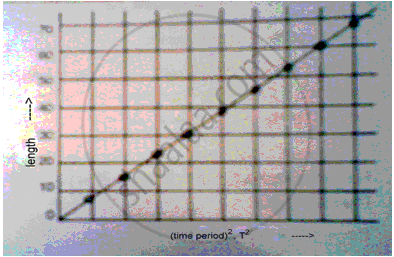
A graph of I against T2 for a simple pendulum of length I and time period T is shown in the figure
APPEARS IN
संबंधित प्रश्न
How are the time period T and frequency f of an oscillation of a simple pendulum related ?
A pupil determines the velocity of sound as 320 ms−1. If the actual velocity of sound is 332 ms−1, calculate the percentage error.
Length of the second’s pendulum is 100 cm. Find the length of another pendulum whose time period is 2.4 s.
State two important precautions for drawing a graph line.
What does the best fit line show regarding the variables plotted and the work of the experimenter?
What do you mean by light year?
Complete the rollowing:
1 light year= ________ m
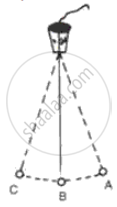
If a pendulum takes 0.5 s to travel from A to B as shown in the following figure, find its time period and frequency.