Advertisements
Advertisements
प्रश्न
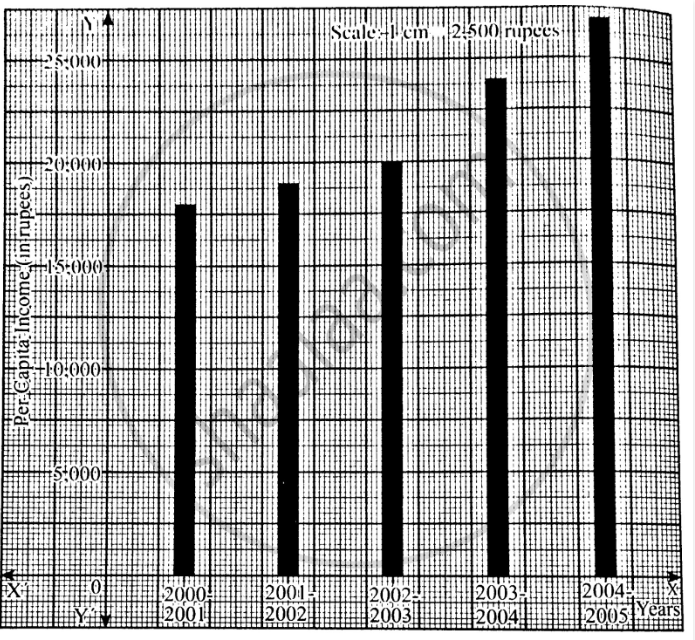
Draw a simple bar graph to represent the following data.
|
Years
|
Per Capita Income
|
|
2000 - 2001
|
18000
|
|
2001 - 2002
|
19000
|
|
2002 - 2003
|
20000
|
|
2003 - 2004
|
24000
|
|
2004 - 2005
|
27000
|
आलेख
उत्तर

shaalaa.com
क्या इस प्रश्न या उत्तर में कोई त्रुटि है?
APPEARS IN
संबंधित प्रश्न
Choose the correct option from the following statement:
Garhjat hills occupy the north - western part of ______________ state.
Match the items in Column ‘A’ with those in the Column ‘B’ :
| Column ‘A’ | Column ‘B’ |
| Shisham | a. A hill station. |
| Guru Shikhar | b. A place of worship |
| Saputara | c. Aravalli Mountains |
| d. The foothills of the Shiwaliks |
Completed the following statement by choosing the appropriate alternative:
__________________ project is built on the Satluj river.
Choose the correct option from the following statement:
The ____________ people lead a nomadic pastoral life in the upper Indus Valley.
