Advertisements
Advertisements
प्रश्न
Examine the effect of (a) fall in the own price of good X and (b) rise in tax rate on good X, on the supply curve. Use diagrams.
उत्तर
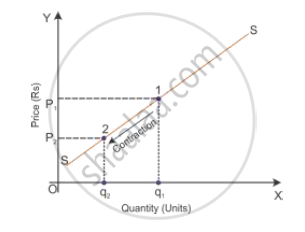
(a) A decline in the own price of Good X shows a positive relationship with the supply of good. When the price declines from P1 to P2, there will be contraction of supply from Q1 to Q2. Hence, the supply curve will move downwards.
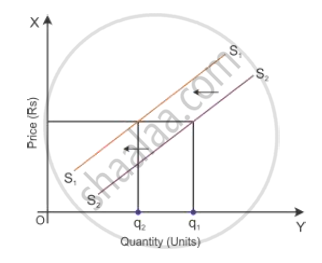
(b) Assuming other things remain constant, the levy of a tax on Good X shows a negative relationship with the supply of a good. When there is a tax on a good, the cost of production increases and decreases the profit of the producer. Hence, it leads to a decrease in the supply of a good which shifts the supply curve towards the left, i.e. S2S2 to S1S1.
APPEARS IN
संबंधित प्रश्न
If price falls, the supply curve will shift to the left.
Explain the distinction between “change in quantity supplied’ and “change in supply”. Use diagram.
Given saving curve, derive consumption curve and state the steps in doing so. Use diagram.
When does ‘increase’ in supply take place?
When does 'decrease' in supply take place?
Explain how technological progress is a determinant of supply of a good by a firm.
How does change in per unit tax influence the supply of a good by a firm? Explain.
Explain with reasons, whether you agree or disagree with the following statement
The supply curve of labour bends backwards
Distinguish between the following.
Percentage method of measuring the elasticity of supply and Geometric method of measuring the elasticity of supply.
What is meant by ‘increase’ in supply?
State with reason whether you agree or disagree with the following statements. (any Three)
Supply curve slope upward from left to right.
Distinguish between :
Percentage method of counting elasticity of demand and Geometric method of counting elasticity of demand.
Give reasons or explain the following statements
The relationship between price and supply is positive.
Answer the following questions in detail.
What is meant by Supply? State its determinants.
Answer with reasons whether you agree or disagree with the following statement:
The supply curve slopes downward from left to right.
Fill in the blank with appropriate alternative given below
Total Revenue ÷ Number of units Sold = ________________ .
State whether the following statement is TRUE and FALSE.
Stock is the source of supply.
Write short note on the following:
Change in supply.
Do you agree or disagree with the following statement? Give reason.
The backward slopping supply curve shown as inverse relationship between supply of labour and wage rate.
