Advertisements
Advertisements
प्रश्न
Explain Keynes's psychological law of consumption function with a diagram.
उत्तर

Proposition (1):
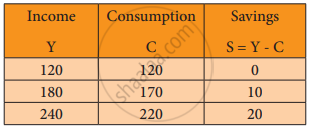
Income increases by ₹ 60 crores and the increase in consumption is by ₹ 50 crores.
Proposition (2):
The increased income of ₹ 60 crores in each case is divided in some proportion between consumption and saving respectively, (i.e., ₹ 50 crores and ₹ 10 crores).
Proposition (3):
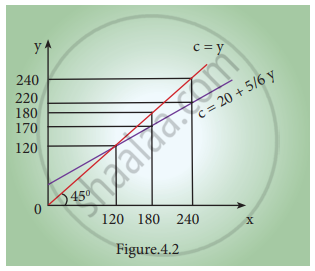
As income increases consumption as well as saving increase. Neither consumption nor saving has fallen. Diagrammatically, the three propositions are explained in the figure. Here, income is measured horizontally and consumption and saving are measured on the vertical axis. C is the consumption function curve and 45° line represents income consumption equality.

Proposition (1):
When income increases from 120 to 180 consumption also increases from 120 to 170 but the increase in consumption is less than the increase in income, 10 is saved.
Proposition (2):
When income increases to 180 and 240, it is divided in some proportion between consumption by 170 and 220 and saving by 10 and 20 respectively.
Proposition (3):
Increases in income to 180 and 240 lead to increased consumption 170 and 220 and increased saving 20 and 10 than before. It is clear from the widening area below the C curve and the saving gap between 45° line and C curve.
APPEARS IN
संबंधित प्रश्न
An increase in the marginal propensity to consume will:
If the Keynesian consumption function is C=10+0.8 Y then, if the disposable income is Rs 1000, what is the amount of total consumption?
If the Keynesian consumption function is C=10+0.8 Y then, and disposable income is ₹100, what is the average propensity to consume?
As national income increases______.
An increase in consumption at any given level of income is likely to lead to ______.
The MPC is equal to :
The sum of the MPC and MPS is _______.
As income increases, consumption will _________.
When investment is assumed autonomous the slope of the AD schedule is determined by the _____.
What is consumption function?
What do you mean by propensity to consume?
Define average propensity to consume (APC).
What do you mean by a propensity to save?
Define Marginal Propensity to Save (MPS).
State the propositions of Keynes’s Psychological Law of Consumption.
Explain any three subjective and objective factors influencing the consumption function.
Briefly explain the subjective and objective factors of consumption function?
