Advertisements
Advertisements
प्रश्न
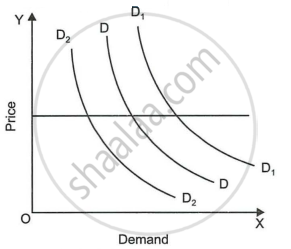
Explain the diagram given below.
उत्तर
The diagram shows change in demand. DD is the initial demand curve. Price remaining the same (at OP level), when demand rises due to changes in factors other than price, the demand curve shifts from DD to D1D1, indicating an increase in demand. The demand curve shifts to the left, as denoted by demand curve D2D2 indicates a decrease in demand when other factors become unfavourable.
संबंधित प्रश्न
With the help of suitable diagram explain the meaning of rightward shift in the demand curve. Explain briefly any two of its determinants.
A fall in income of the consumer (in the case of normal goods) will cause a/an ______.
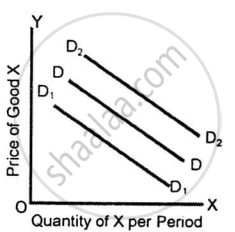
The diagram given below shows the original demand curve (DD) for good X, which is a complement of good Y:
If there is a rise in the price of good Y, which demand curve for good X is relevant?
The market demand curve is a ______ summation of all individual demand curves.
State the impact of the following changes on the demand curve of a commodity:
increase in individual income
State the impact of the following changes on the demand curve of a commodity:
A rise in the price of the commodity
State the impact of the following changes on the demand curve of a commodity:
Increase in the supply of a substitute commodity
State the impact of the following changes on the demand curve of a commodity:
Increase in the price of a complementary commodity
With the help of a hypothetical table, draw the demand curve of a commodity.
Define market demand.
