Advertisements
Advertisements
प्रश्न
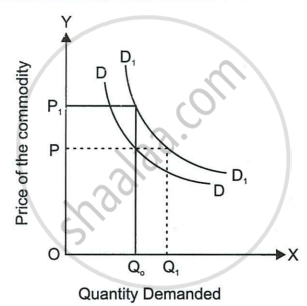
Explain the following diagram.

उत्तर
- In the diagram, the demand curve shifts to the right from DD to D1D1.
- It shows the situation of increase in demand.
- A larger quantity (OQ1) instead of OQ0 is demanded at the same price of OP.
- Same quantity OQ0 is demanded at a higher price of OP1.
APPEARS IN
संबंधित प्रश्न
What is meant by an increase in demand?
As a result of rise in consumer's income, the demand curve for coarse-grain (inferior good) will:
Differentiate between extension and contraction of demand.
What does an upward movement along the same demand curve indicate?
When the demand curve of a product shifts to the right, it represents a situation of ______.
What is an expansion of demand?
Give two reasons for the shift of the demand curve towards the left.
In order to encourage tourism in Goa, Government of India suggests Indian Airlines to reduce air fares to Goa from four major cities: Chennai, Kolkata, Mumbai and New Delhi. If the Indian Airlines reduces the air fare to Goa, how will this affect the market demand curve for air travel to Goa?
What is meant by an increase in demand?
Give two factors responsible for the shift of the demand curve to the right.
