Advertisements
Advertisements
प्रश्न
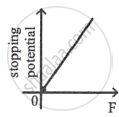
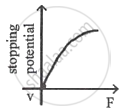
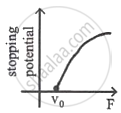
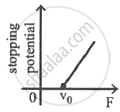
Following graphs show the variation of stopping potential corresponding to the frequency of incident radiation (F) for a given metal. The correct variation is shown in graph (v0 = Threshold frequency).
विकल्प
MCQ
आलेख
उत्तर
Explanation:
The following diagram illustrates how the stopping potential changes depending on the frequency of the incident radiation (F).
shaalaa.com
The Photoelectric Effect
क्या इस प्रश्न या उत्तर में कोई त्रुटि है?
