Advertisements
Advertisements
प्रश्न
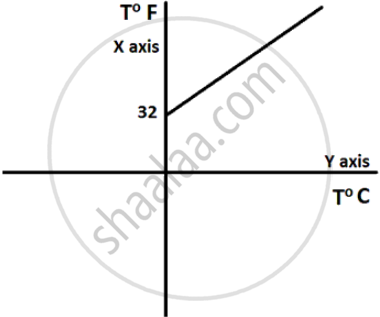
Plot a graph taking °C on the Y-axis and the corresponding °F along the X-axis.
आलेख
उत्तर
We know C/100 = (F - 32)/180.
C =5/9 (F- 32 )
9/SC + 32 = F
F = 9/ SC + 32.
The graph between T°F and T°C is a straight line having a slope of 9/5 and the intercept on Y-axis is 32.

shaalaa.com
क्या इस प्रश्न या उत्तर में कोई त्रुटि है?
APPEARS IN
संबंधित प्रश्न
Convert 5°F to the Celsius scale.
State the volume changes that you will observe when a given mass of water is heated from 0°C to 10°C. Sketch a temperature-volume graph to show the behaviour.
Who am I?
I’m found in a thermometer, I measure your temperature.
Write down the SI unit of latent heat.
Why do we wear woolen clothes in winter?
Water is not used as a thermometric liquid. Why?
The temp. of two bodies differ by 1°C. What is the difference on the Fahrenheit scale of temperature?
Explain the following:
It is cool in the shade, when it is hot outside.
Analogy
Ice cube : 0o C :: Boiling water :______
What do you mean by thermal equilibrium?
