Advertisements
Advertisements
प्रश्न
Read the bar graph given below and answer the following questions:
Scale: 1 unit = 50 students
(a) What information is given by the bar graph?
(b) In which year is the number of students maximum?
(c) In which year is the number of students twice as that of 2001 – 02?
(d) In which year did the number of students decrease as compared to previous year?
(e) In which year is the increase in number of students maximum as compared to the previous year?
उत्तर
(a) The given bar graph shows the number of students in different academic years.
(b) In the year 2005 – 06, the number of students is maximum.
(c) Since, number of students in 2001 – 02 is 150 and number of students in 2004 – 05 is 300. So, in the year 2004 – 05, the number of students is twice as that of 2001 – 02.
(d) The year is 2003 – 04 in which the number of students decreased as compared to previous year.
(e) The year is 2004 – 05 in which the increase in number of students is maximum as compared to the previous year.
APPEARS IN
संबंधित प्रश्न
The performance of students in 1st Term and 2nd Term is given. Draw a double bar graph choosing appropriate scale and answer the following:
| Subject | English | Hindi | Maths | Science | S. science |
| 1st Term (M.M. 100) | 67 | 72 | 88 | 81 | 73 |
| 2nd Term (M.M. 100) | 70 | 65 | 95 | 85 | 75 |
- In which subject, has the child improved his performance the most?
- In which subject is the improvement the least?
- Has the performance gone down in any subject?
The following table shows the number of Buses and Trucks in nearest lakh units. Draw percentage bar-diagram. (Approximate the percentages to the nearest integer)
| Year | No. of Trucks | No. of Buses |
| 2006-2007 | 47 | 9 |
| 2007-2008 | 56 | 13 |
| 2008-2009 | 60 | 16 |
| 2009-2010 | 63 | 18 |
Bar diagram of first term scores of a student are given.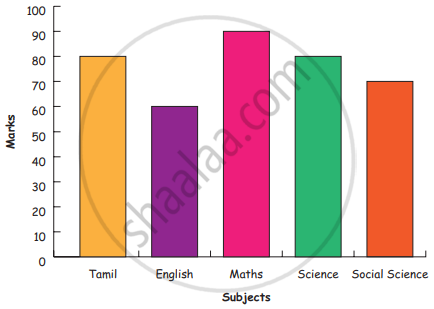
a. The highest score is in _________.
b. The lowest score is in _________.
c. The same scores are in _________ and _________.
The following bar graph represents the data for different sizes of shoes worn by the students in a school. Read the graph and answer the following questions.
Scale: 1 unit length = 50 students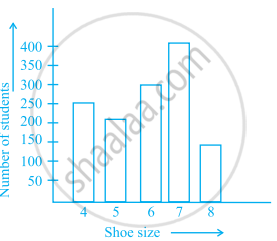
(a) Find the number of students whose shoe sizes have been collected.
(b) What is the number of students wearing shoe size 6?
(c) What are the different sizes of the shoes worn by the students?
(d) Which shoe size is worn by the maximum number of students?
(e) Which shoe size is worn by minimum number of students?
(f) State whether true or false:
The total number of students wearing shoe sizes 5 and 8 is the same as the number of students wearing shoe size 6.
The following graph gives the information about the number of railway tickets sold for different cities on a railway ticket counter between 6.00 am to 10.00 am. Read the bar graph and answer the following questions.
Scale: 1 unit length = 10 tickets
(a) How many tickets were sold in all?
(b) For which city were the maximum number of tickets sold?
(c) For which city were the minimum number of tickets sold?
(d) Name the cities for which the number of tickets sold is more than 20
(e) Fill in the blanks: Number of tickets sold for Delhi and Jaipur together exceeds the total number of tickets sold for Patna and Chennai by ______.
The bar graph given below represents the circulation of newspapers in different languages in a town. Study the bar graph and answer the following questions:
Scale: 1 unit length = 200 Newspapers
(a) What is the circulation of English newspaper?
(b) Name the two languages in which circulation of newspaper is the same.
(c) By how much is the circulation of newspaper in Hindi more than the newspaper in Bengali?
The lengths in km (rounded to nearest hundred) of some major rivers of India is given below
| River | Length (in km) |
| Narmada | 1300 |
| Mahanadi | 900 |
| Brahmputra | 2900 |
| Ganga | 2500 |
| Kaveri | 800 |
| Krishna | 1300 |
Draw a bar graph to represent the above information.
Study the bar graph given below and answer the questions that follow.

- What information does the above bar graph represent?
- In which year was production the least?
- After which year was the maximum rise in the production?
- Find the average production of rice during the 5 years.
- Find difference of rice production between years 2006 and 2008.
Study the double bar graph and answer the questions that follow:

- What information does the double bar graph represent?
- Find the total number of boys in all sections of Class VII.
- In which sections, the number of girls is greater than the number of boys?
- In which section, the number of boys is the maximum?
- In which section, the number of girls is the least?
Below is a list of 10 tallest buildings in India.
This list ranks buildings in India that stand at least 150 m (492 ft.) tall, based on standard height measurement. This includes spires and architectural details but does not include antenna marks. Following data is given as per the available information till 2009. Since new buildings are always under construction, go on-line to check new taller buildings.
Use the information given in the table about sky scrapers to answer the following questions:
| Name | City | Height | Floors | Year |
| Planet | Mumbai | 181 m | 51 | 2009 |
| UB Tower | Bengaluru | 184 m | 20 | 2006 |
| Ashok Towers | Mumbai | 193 m | 49 | 2009 |
| The Imperial I | Mumbai | 249 m | 60 | 2009 |
| The Imperial II | Mumbai | 249 m | 60 | 2009 |
| RNA Mirage | Mumbai | 180 m | 40 | 2009 |
| Oberoi Woods Tower I | Mumbai | 170 m | 40 | 2009 |
| Oberoi Woods Tower II | Mumbai | 170 m | 40 | 2009 |
| Oberoi Woods Tower III | Mumbai | 170 m | 40 | 2009 |
| MVRDC | Mumbai | 156 m | 35 | 2002 |
(a) Find the height of each storey of the three tallest buildings and write them in the following table:
| Building | Height | Number of storeys | Height of each storey |
(b) The average height of one storey for the buildings given in (a) is ______.
(c) Which city in this list has the largest percentage of skyscrapers? What is the percentage?
(d) What is the range of data?
(e) Find the median of the data.
(f) Draw a bar graph for given data.
