Advertisements
Advertisements
प्रश्न
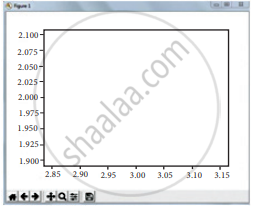
Read the code:
a. import matplotlib.pyplot as plt
b. plt.plot(3,2)
c. plt.show()
Identify the output for the above coding.
विकल्प
उत्तर

APPEARS IN
संबंधित प्रश्न
Explain in detail the types of pyplots using Matplotlib.
Explain the various buttons in a matplotlib window.
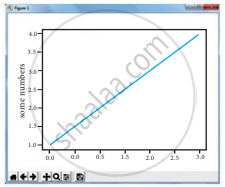
Write the difference between the following functions: plt.plot([1,2,3,4]), plt.plot([1,2,3,4], [1,4,9,16]).
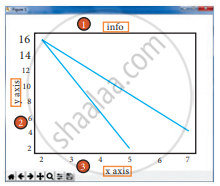
Observe the output figure. Identify the coding for obtaining this output.

Read the statements given below. Identify the right option from the following pie chart.
Statement A: To make a pie chart with Matplotlib, we can use the plt.pie() function.
Statement B: The autopct parameter allows us to display the percentage value using the Python string formatting.
Identify the right type of chart using the following hints.
Hint 1: This chart is often used to visualize a trend in data over intervals of time.
Hint 2: The line in this type of chart is often drawn chronologically.


