Advertisements
Advertisements
प्रश्न
State two differences between the rainfalls that occur from June to September and that from December to February in North India.
उत्तर
Two differences between the rainfalls which occur from June to September and from
December to February in North India are:
| Rainfall from June to September | Rainfall from December to February |
| The rainfall is caused due to the South West monsoon winds. | The rainfall is caused due to the western depression. |
| The northern parts of the country receive moderate to adequate rainfall. | The northern part of the country receives low rainfall which is useful for the rabi crops. |
APPEARS IN
संबंधित प्रश्न
Name an area in India where Tropical Monsoon forest is found.
| Stations | Latitude | Altitude (Metres) | Jan. | Feb. | Mar. | Apr. | May. | Jun. | July. | Aug. | Sep. | Oct. | Nov. | Dec. | Annual Rainfall |
|
Temperature (°C) |
20.5 |
22.7 |
25.2 |
27.1 |
26.7 |
24.2 |
23.0 |
23.0 |
23.1 |
22.9 |
18.9 |
20.2 |
|||
| Bengaluru | 12°58'N | 909 |
|
|
|
||||||||||
| Rainfall (cm) | 0.7 | 0.9 | 1.1 | 4.5 | 10.7 | 7.1 | 11.1 | 13.7 | 16.4 |
15.3 |
6.1 |
1.3 |
88.9 | ||
|
Temperature (°C) |
24.4 |
24.4 |
26.7 |
28.3 |
30.0 |
28.9 |
27.2 |
27.2 |
27.2 |
27.8 |
27.2 |
25.0 |
|||
|
Mumbai |
19° N | 11 |
|
|
|
|
|
|
|
|
|
|
|
|
|
|
Rainfall (cm) |
0.2 |
0.2 |
– |
– |
1.8 |
50.6 |
61.0 |
36.9 |
26.9 |
4.8 |
1.0 |
– |
183.4 | ||
|
Temperature (°C) |
19.6 |
22.0 |
27.1 |
30.1 |
30.4 |
29.9 |
28.9 |
28.7 |
28.9 |
27.6 |
23.4 |
19.7 |
|||
|
Kolkata |
22°34'N | 6 |
|
|
|
|
|
|
|
|
|
|
|
|
|
|
Rainfall (cm) |
1.2 |
2.8 |
3.4 |
5.1 |
13.4 |
29.0 |
33.1 |
33.4 |
25.3 |
12.7 |
2.7 |
0.4 |
162.5 | ||
|
Temperature (°C) |
14.4 |
16.7 |
23.3 |
30.0 |
33.3 |
33.3 |
30.0 |
29.4 |
28.9 |
25.6 |
19.4 |
15.6 |
|||
|
Delhi |
29° N | 219 |
|
|
|
|
|
|
|
|
|
|
|
|
|
|
Rainfall (cm) |
2.5 |
1.5 |
1.3 |
1.0 |
1.8 |
7.4 |
19.3 |
17.8 |
11.9 |
1.3 |
0.2 |
1.0 |
67.0 | ||
|
Temperature (°C) |
16.8 |
19.2 |
26.6 |
29.8 |
33.3 |
33.9 |
31.3 |
29.0 |
20.1 |
27.0 |
20.1 |
14.9 |
|||
|
Jodhpur |
26°18'N | 224 |
|
|
|
|
|
|
|
|
|
|
|
|
|
|
Rainfall (cm) |
0.5 |
0.6 |
0.3 |
0.3 |
1.0 |
3.1 |
10.8 |
13.1 |
5.7 |
5.7 |
0.2 |
0.2 |
36.6 | ||
|
Temperature (°C) |
24.5 |
25.7 |
27.7 |
30.4 |
33.0 |
32..5 |
31.0 |
30.2 |
29.8 |
28.0 |
25.9 |
24.9 |
|||
|
Chennai |
13°4'N | 7 |
|
|
|
|
|
|
|
|
|
|
|
|
|
|
Rainfall (cm) |
4.6 |
1.3 |
1.3 |
1.8 |
3.8 |
22.2 |
8.7 |
11.3 |
11.9 |
30.6 |
35.0 |
0.2 |
128.6 | ||
|
Temperature (°C) |
21.5 |
23.9 |
28.3 |
32.7 |
35.5 |
32.0 |
27.7 |
27.3 |
27.9 |
26.7 |
23.1 |
20.7 |
|||
|
Nagpur |
21°9'N | 312 |
|
|
|
|
|
|
|
|
|
|
|
|
|
|
Rainfall (cm) |
1.1 |
2.3 |
1.7 |
1.6 |
2.1 |
22.2 |
37.6 |
28.6 |
18.5 |
5.5 |
2.0 |
13.9 |
124.2 | ||
|
Temperature (°C) |
9.8 |
11.3 |
15.9 |
18.5 |
19.2 |
20.5 |
21.1 |
20.9 |
20.9 |
17.2 |
13.3 |
10.4 |
|||
|
Shillong |
24°34'N | 1461 |
|
|
|
|
|
|
|
|
|
|
|
|
|
|
Rainfall (cm) |
1.4 |
2.9 |
5.6 |
14.6 |
29.5 |
47.6 |
35.9 |
34.3 |
30.2 |
18.8 |
3.8 |
1.0 |
225.3 | ||
|
Temperature (°C) |
26.7 |
27.3 |
28.3 |
28.7 |
28.6 |
26.6 |
26.2 |
26.2 |
26.5 |
26.7 |
26.6 |
26.5 |
|||
|
Thiruvananthapuram |
8°29'N | 61 |
|
|
|
|
|
|
|
|
|
|
|
|
|
|
Rainfall (cm) |
2.3 |
2.1 |
3.7 |
10.6 |
20.8 |
35.6 |
22.3 |
14.6 |
13.8 |
27.3 |
20.6 |
7.5 |
181.2 | ||
|
Temperature (°C) |
−8.5 |
−7.2 |
−0.6 |
6.1 |
10.0 |
14.4 |
17.2 |
16.1 |
12.2 |
6.1 |
0.0 |
−5.6 |
|||
|
Leh |
34°N | 3506 |
|
|
|
|
|
|
|
|
|
|
|
|
|
|
Rainfall (cm) |
1.0 |
0.8 |
0.8 |
0.5 |
0.5 |
0.5 |
1.3 |
1.3 |
0.8 |
0.5 |
– |
0.5 |
8.5 |
In above Table the average mean monthly temperatures and amounts of rainfall of ten representative stations have been given. It is for you to study on your own and convert them into ‘temperature and rainfall’ graphs. A glance at these visual representations will help you to grasp instantly the similarities and differences between them. One such graph (Figure 1) is already prepared for you. See if you can arrive at some broad generalisations about our diverse climatic conditions. 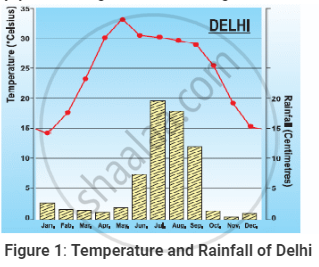
Mumbai receives rainfall in the summer season while Chennai receives rainfall from October to December. Why?
Study the climatic data provided below and answer the questions that follow:
| Month | Jan | Feb | Mar | Apr | May | June | Jul | Aug | Sep | Oct | Nov | Dec |
| Station A (sea level) | ||||||||||||
| Temperature (°C) | 24.4 | 28.4 | 20.7 | 29.3 | 30.0 | 29.9 | 29.8 | 27.8 | 26.9 | 26.3 | 25.1 | 24.8 |
| Rainfall (cm) | 0.1 | 0.1 | 0.5 | 0.6 | 3.8 | 26.6 | 29.6 | 30.5 | 26.5 | 11.9 | 1.1 | 0.2 |
| Station B (800 m above sea level) | ||||||||||||
| Temperature (°C) | 8.1 | 8.9 | 15.6 | 20.1. | 25.2 | 24.3 | 24.1 | 22.7 | 20.6 | 18.4 | 14.1 | 9.6 |
| Rainfall (cm) | 0.4 | 0.3 | 0.3 | 1.1 | 1.3 | 3.2 | 7.7 | 1.3 | 5.8 | 0.7 | 0.4 | 0.3 |
- Calculate the annual range of temperature of Station A Suggest a reason why the range is small one.
- Which of the two Stations has the lower temperature? Why?
- Calculate the annual rainfall of Station B.
Given below is the climatic data of a station. Study the table and answer the questions that follow:
| Month | J | F | M | A | M | J | J | A | S | O | N | D |
| Temperature in Degree C. | 13.7 | 16.6 | 21.6 | 25.5 | 33.2 | 33.5 | 30.8 | 29.8 | 29.2 | 25.5 | 19.6 | 15.2 |
| Rainfall in cms. | 2.5 | 2.0 | 1.5 | 0.9 | 1.5 | 7.5 | 17.8 | 18.5 | 12.5 | 1.0 | 0.2 | 1.5 |
(i) Calculate the annual range of temperature.
(ii) What is the total rainfall experienced by the station?
(iii) Which is the driest month?
In India, 85% of the rain is received from the ______.
Give reasons for the following topic:
Kolkatta receives more rainfall than Bikaner in Rajasthan.
Now find out
Why are Tiruvanantapuram and Shillong rainier in June than in July?
Now find out
Why is Kolkata rainier in July than in June unlike Shillong which is rainier in June than in July?
Study the climate data of Station X and answer the questions that follow:
| Month | Jan. | Feb. | Mar. | Apr. | May | June | July | Aug. | Sep. | Oct. | Nov. | Dec. |
| Temperature °C | 21.0 | 21.9 | 24.3 | 27.2 | 28.0 | 26.4 | 26.1 | 25.4 | 26.0 | 26.0 | 23.8 | 21.2 |
| Rainfall in cm | 5.1 | 2.8 | 1.2 | 1.7 | 3.9 | 4.6 | 8.4 | 11.4 | 11.9 | 31.6 | 34.5 | 14.8 |
- Calculate the annual range of temperature of Station X.
- Name the wind that brings most of the rainfall to this station.
- On which coast of India is Station X located?
