Advertisements
Advertisements
प्रश्न
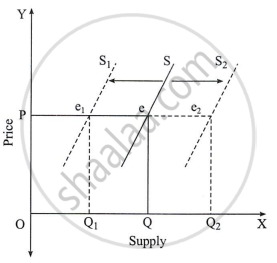
Study the following diagram and answer the questions:

Questions:
- The diagram shows the `square` relationship between price and supply.
- The supply curve 'S' has a `square` slope.
- In a decrease in supply, the equilibrium point shifts from 'e' to `square`.
- In an increase in supply, the equilibrium point shifts from 'e ' to `square`.
रिक्त स्थान भरें
उत्तर
- The diagram shows the direct relationship between price and supply.
- The supply curve 'S' has a positive slope.
- In a decrease in supply, the equilibrium point shifts from 'e' to 'e1'.
- In an increase in supply, the equilibrium point shifts from 'e ' to 'e2'.
shaalaa.com
क्या इस प्रश्न या उत्तर में कोई त्रुटि है?
