Advertisements
Advertisements
प्रश्न
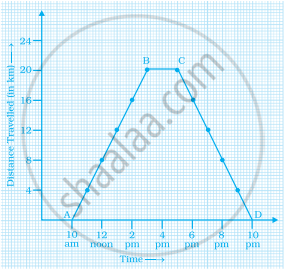
Study the graph given below of a person who started from his home and returned at the end of the day. Answer the questions that follow.

- At what time did the person start from his home?
- How much distance did he travel in the first four hours of his journey?
- What was he doing from 3 pm to 5 pm?
- What was the total distance travelled by him throughout the day?
- Calculate the distance covered by him in the first 8 hours of his journey.
- At what time did he cover 16 km of his journey?
- Calculate the average speed of the man from (a) A to B (b) B to C.
- At what time did he return home?
उत्तर
Observing the graph carefully, we conclude that
- At 10 AM, the person start from his home.
- In first 4 h (i.e. till 2 PM), he travelled 16 km.
- He was taking rest from 3 PM to 5 PM.
- The total distance covered by the person throughout the day was 40 km, i.e. 20 km from A to S and then 20 km from C to D.
- The distance covered by him in the first 8 h i.e. from 10 AM to 6 PM was 24 km.
- He covered 16 km of his journey at 2 PM.
- The total distance covered from A to S = 20 km and the time taken to travel from A to B = 5 h
∴ Average speed of the man from A to B = 20/5 = 4 km/h and average speed from S to C = 0/2 = 0 km/h - He returned home at 10 PM.
APPEARS IN
संबंधित प्रश्न
Plot the following points on a graph sheet. Verify if they lie on a line
K(2, 3), L(5, 3), M(5, 5), N(2, 5)
State whether True or False. Correct those are false.
The coordinates of the origin are (0, 0).
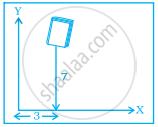
In the given figure the position of the book on the table may be given by ______.

For fixing a point on the graph sheet we need two coordinates.
The distance of the point (3, 5) from the y-axis is 5.
Locate the points A(1, 2), B(4, 2) and C(1, 4) on a graph sheet taking suitable axes. Write the coordinates of the fourth point D to complete the rectangle ABCD.
The following table gives the growth chart of a child.
| Height (in cm) | 75 | 90 | 110 | 120 | 130 |
| Age (in years) | 2 | 4 | 6 | 8 | 10 |
Draw a line graph for the table and answer the questions that follow.
- What is the height at the age of 5 years?
- How much taller was the child at the age of 10 than at the age of 6?
- Between which two consecutive periods did the child grow more faster?
Extend the line segment on both sides to meet the coordinate axes. What are the coordinates of the points where this line meets the x-axis and the y-axis?
Draw the line graph using suitable scale to show the annual gross profit of a company for a period of five years.
| Year | 1st | 2nd | 3rd | 4th | 5th |
| Gross Profit (in Rs) |
17,00,000 | 15,50,000 | 11,40,000 | 12,10,000 | 14,90,000 |
Observe the toothpick pattern given below:
(a) Imagine that this pattern continues. Complete the table to show the number of toothpicks in the first six terms.
| Pattern | 1 | 2 | 3 | 4 | 5 | 6 |
| Toothpicks | 4 | 13 |
(b) Make a graph by taking the pattern numbers on the horizontal axis and the number of toothpicks on the vertical axis. Make the horizontal axis from 0 to 10 and the vertical axis from 0 to 30.
(c) Use your graph to predict the number of toothpicks in patterns 7 and 8. Check your answers by actually drawing them.
(d) Would it make sense to join the points on this graph? Explain.
