हिंदी
सी.आई.एस.सी.ई.आईसीएसई ICSE Class 6

The Column Graph, Given Above, Shows the Number of Patients, Examined by Dr. V.K. Bansal, on Different Days of a Particular Week. - Mathematics

Advertisements
Advertisements

प्रश्न

The column graph, given above, shows the number of patients, examined by Dr. V.K. Bansal, on different days of a particular week.

Use the graph to answer the following:

What is the total number of patients examined in the week?

आलेख
एक पंक्ति में उत्तर

उत्तर

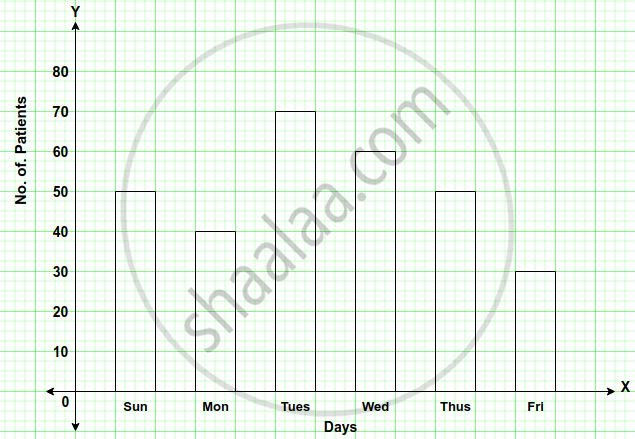
Total number of patients examined in the week

= 50 + 40 + 70 + 60 + 50 + 30

= 300

shaalaa.com
  क्या इस प्रश्न या उत्तर में कोई त्रुटि है?
अध्याय 33: Data Handling (Including Pictograph and Bar Graph) - Exercise 33 (C)

APPEARS IN

सेलिना Mathematics [English] Class 6
अध्याय 33 Data Handling (Including Pictograph and Bar Graph)
Exercise 33 (C) | Q 9.4
Share
Notifications

Englishहिंदीमराठी


      Forgot password?
Use app×