Advertisements
Advertisements
प्रश्न
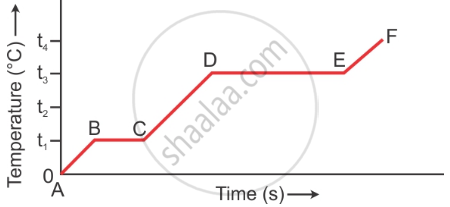
The diagram in Figure below shows the change of phase of a substance on a temperature time graph on heating the substances at a constant rate.

- What do the parts AB, BC, CD and DE represent?
- What is the melting points of the substance?
- What is the boiling points of the substance?
संक्षेप में उत्तर
उत्तर
- AB part shows rise in temperature of solid from 0°C to t1°C, BC part shows melting at temperature t1°C, CD part shows rise in temperature of liquid from t1°C to t3°C, DE part shows boiling at temperature t3°C.
- t1°C is the melting point of a substance.
- t3°C is the boiling point of a substance.
shaalaa.com
Heating Curve for Water
क्या इस प्रश्न या उत्तर में कोई त्रुटि है?
