Advertisements
Advertisements
प्रश्न
The rates of petrol are different in each city. The rates of petrol and diesel in Delhi are given here. Look at the table and answer the questions.
| Oil | Rate of one litre in 2002 (Oct) | Rate of one litre in 2007 (Oct) | Rate of one litre in 2014 (Oct) |
| Petrol | Rs 29.91 | Rs 43.52 | Rs 67.86 |
| Diesel | Rs 18.91 | Rs 30.48 | Rs 58.97 |
- What was the difference in the rates of petrol and diesel from 2002 to 2007 and 2007 to 2014?
उत्तर
- The difference in the rates of petrol from 2002 to 2007 is 13.61 rupees and diesel is 11.57 rupees.
- The difference in the rates of petrol from 2007 to 2014 is 23.34 rupees and diesel is 28.49 rupees.
APPEARS IN
संबंधित प्रश्न

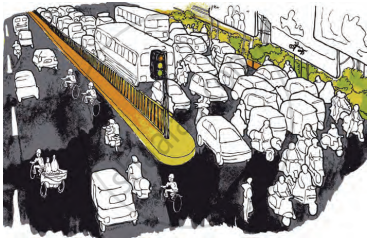
- What problems do we face from speeding vehicles?
How do your family members go to work from home?
Which states of India have oil fields?
Find out the traffic rules and discuss them in the class.
The rates of petrol are different in each city. The rates of petrol and diesel in Delhi are given here. Look at the table and answer the questions.
| Oil | Rate of one litre in 2002 (Oct) | Rate of one litre in 2007 (Oct) | Rate of one litre in 2014 (Oct) |
| Petrol | Rs 29.91 | Rs 43.52 | Rs 67.86 |
| Diesel | Rs 18.91 | Rs 30.48 | Rs 58.97 |
- In 2014, as compared to 2007 the rate of petrol went up by ______ rupees. The rate of diesel increased by ______ rupees.

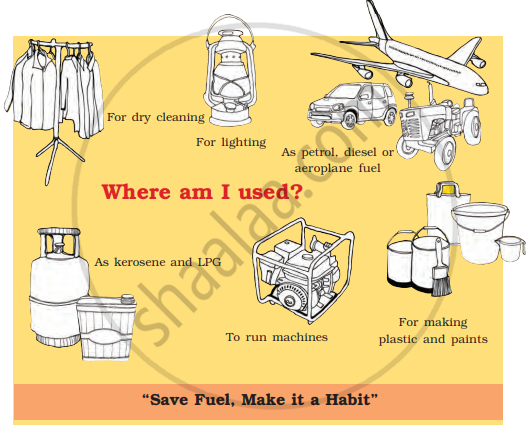
- Where is diesel used? Find out.
What would happen if you don’t get petrol or diesel for a week in your village or town?

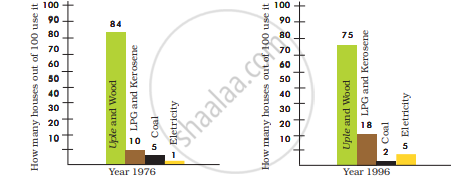
1. In the year 1976, out of 100 how many houses used uple and wood?
2. Which was the fuel used the least in 1976?
3. In 1976, LPG and kerosene were used in ______ houses, and in 1996 this increased to ______. This means that in twenty years their use increased by________%.
4. Out of 100, how many houses were using electricity in 1996?
5. Which fuel was used the least in 1996? What percentage of houses used it in the year 1976?
Imagine that a company has given you a chance to design a new vehicle like a minibus. What kind of vehicle would you design? Write about it. Draw a picture and colour it.
Look out for news reports on oil. Cut these and make a collage. Put up a chart in your classroom. Also, write your own views on these news reports.
