Advertisements
Advertisements
प्रश्न
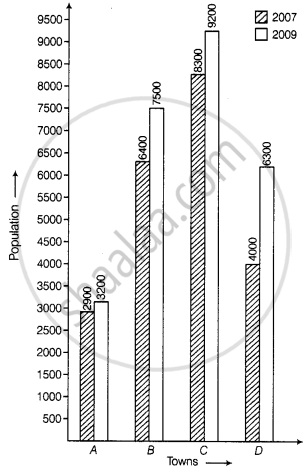
The table below compares the population (in hundreds) of 4 towns over two years:
| Towns | A | B | C | D |
| 2007 | 2900 | 6400 | 8300 | 4600 |
| 2009 | 3200 | 7500 | 9200 | 6300 |
Study the table and answer the following questions:
- Draw a double bar graph using appropriate scale to depict the above information.
- In which town was the population growth maximum?
- In which town was the population growth least?
उत्तर
a. Steps to construct the bar graph are as follows:
Step I: We draw two lines perpendicular to each other on a graph paper and call them horizontal and vertical axes.
Step II: Along the horizontal axis, OX mark the towns and along the vertical axis, OY mark the population.
Step III: We choose a suitable scale to determine the heights of bars. Here, we choose the scale as 1 small division to represent
500,
Step IV: First, we draw the bars for year 2007 and then bars for year 2009 for different towns.
Bars for year 2007 and 2009 are shaded separately and the shading is shown in the top right corner of the graph paper.

b. It is clear from the graph, the population growth of town D was maximum.
c. It is clear from the graph, the population growth of town A was minimum.
APPEARS IN
संबंधित प्रश्न
Take the data giving the minimum and the maximum temperature of various cities given in the following table:
| Temperatures of the cities as on 20.6.2006 | ||
| City | Max. | Min. |
| Ahmedabad | 38ºC | 29ºC |
| Amritsar | 37ºC | 26ºC |
| Banglore | 28ºC | 21ºC |
| Chennai | 36ºC | 27ºC |
| Delhi | 38ºC | 28ºC |
| Jaipur | 39ºC | 29ºC |
| Jammu | 41ºC | 26ºC |
| Mumbai | 32ºC | 27ºC |
Plot a double bar graph using the data and answer the following:
- Which city has the largest difference in the minimum and maximum temperature on the given date?
- Which is the hottest city and which is the coldest city?
- Name two cities where maximum temperature of one was less than the minimum temperature of the other.
- Name the city which has the least difference between its minimum and the maximum temperature.
The following table shows the number of Buses and Trucks in nearest lakh units. Draw percentage bar-diagram. (Approximate the percentages to the nearest integer)
| Year | No. of Trucks | No. of Buses |
| 2005-2006 | 47 | 9 |
| 2007-2008 | 56 | 13 |
| 2008-2009 | 60 | 16 |
| 2009-2010 | 63 | 18 |
The graph shows the maximum temperatures recorded for two consecutive weeks of a town. Study the graph and answer the questions that follow.

- What information is given by the two axes?
- In which week was the temperature higher on most of the days?
- On which day was the temperature same in both the weeks?
- On which day was the difference in temperatures the maximum for both the weeks?
- What were the temperatures for both the weeks on Thursday?
- On which day was the temperature 35°C for the first week?
- On which day was the temperature highest for the second week?
The following chart gives the growth in height in terms of percentage of full height of boys and girls with their respective ages.
| Age (in years) | 8 | 9 | 10 | 11 | 12 | 13 | 14 | 15 | 16 | 17 |
18 |
| Boys | 72% | 75% | 78% | 81% | 84% | 88% | 92% | 95% | 98% | 99% | 100% |
| Girls | 77% | 81% | 84% | 88% | 91% | 95% | 98% | 99% | 99.5% | 100% | 100% |
Draw the line graph of above data on the same sheet and answer the following questions.
- In which year both the boys and the girls achieve their maximum height?
- Who grows faster at puberty (14 years to 16 years of age)?
In a bar graph, the gap between two consecutive bars may not be the same.
In a bar graph, bars of ______ width can be drawn horizontally or vertically with ______ spacing between them.
The bar graph given below represents approximate length (in kilometres) of some National Highways in India. Study the bar graph and answer the following questions:
Scale: 1 unit length = 200 km
(a) Which National Highway (N.H.) is the longest among the above?
(b) Which National Highway is the shortest among the above?
(c) What is the length of National Highway 9?
(d) Length of which National Highway is about three times the National Highway10?
The bar graph given below represents the circulation of newspapers in different languages in a town. Study the bar graph and answer the following questions:
Scale: 1 unit length = 200 Newspapers
(a) What is the circulation of English newspaper?
(b) Name the two languages in which circulation of newspaper is the same.
(c) By how much is the circulation of newspaper in Hindi more than the newspaper in Bengali?
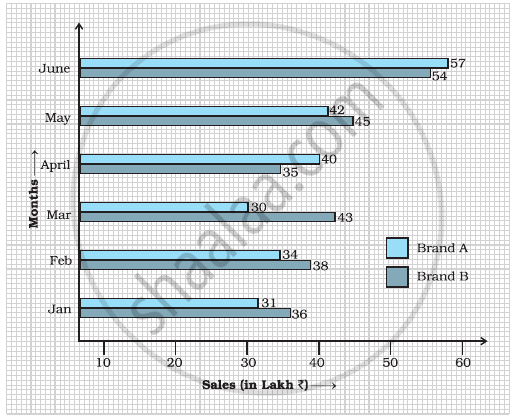
Study the double bar graph shown below and answer the questions that follow:

- What information is represented by the above double bar graph?
- In which month sales of Brand A decreased as compared to the previous month?
- What is the difference in sales of both the Brands for the month of June?
- Find the average sales of Brand B for the six months.
- List all months for which the sales of Brand B was less than that of Brand A.
- Find the ratio of sales of Brand A as compared to Brand B for the month of January.
Study the double bar graph and answer the questions that follow:

- What information does the double bar graph represent?
- Find the total number of boys in all sections of Class VII.
- In which sections, the number of girls is greater than the number of boys?
- In which section, the number of boys is the maximum?
- In which section, the number of girls is the least?
