Advertisements
Advertisements
प्रश्न
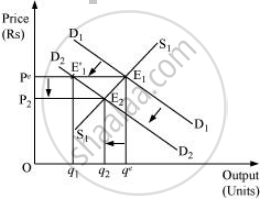
Using supply and demand curves, show how an increase in the price of shoes affects the price of a pair of socks and the number of pairs of socks bought and sold.
उत्तर
Shoes and socks both are complementary to each other and are used together. Therefore, the increase in shoe price will discourage the demand for socks. Therefore, due to the decrease in demand for socks, the demand curve for socks will shift leftwards parallelly from D1D1 to D2D2. The supply remaining unchanged, at the equilibrium price Pe, there exists excess supply of socks, which reduces the price of socks and the new equilibrium will be at E2, with equilibrium price P2 and equilibrium quantity q2.

APPEARS IN
संबंधित प्रश्न
A market for a good is in equilibrium. There is simultaneous "increase" both in demand and supply of the good. Explain its effect on the market price
Market for a good is in equilibrium. There is simultaneous "decrease" both in demand and supply of the good. Explain its effect on market price
A market for a good is in equilibrium. The demand for the good 'increases'. Explain the chain of effects of this change.
A market for a good is in equilibrium. The supply of good "decreases". Explain the chain of effects of this change
What is meant by 'excess supply' of a good in a market?
Explain its chain of effects on the market of that good. Use diagram
Draw average revenue and marginal revenue curves in a single diagram of a firm which can sell more units of a good only by lowering the price of that good. Explain.
Market for a good is in equilibrium. There is an ‘increase’ in demand for this good. Explain the chain of effects of this change. Use diagram.
What will happen if the price prevailing in the market is
(i) above the equilibrium price?
(ii) below the equilibrium price?
How are equilibrium price and quantity affected when income of the consumers increase.
How will a change in price of coffee affect the equilibrium price of tea? Explain the effect on equilibrium quantity also through a diagram.
How do the equilibrium price and the quantity of a commodity change when price of input used in its production changes?
Compare the effect of shift in the demand curve on the equilibrium when the number of firms in the market is fixed with the situation when entry-exit is permitted.
Considering the same demand curve as in exercise 22, now let us allow for free entry and exit of the firms producing commodity X. Also assume the market consists of identical firms producing commodity X. Let the supply curve of a single firm be explained as
qSf = 8 + 3p for p ≥ 20
= 0 for 0 ≤ p < 20
(a) What is the significance of p = 20?
(b) At what price will the market for X be in equilibrium? State the reason for your answer.
(c) Calculate the equilibrium quantity and number of firms.
Answer the following question.
Show with the help of diagrams, the effect on equilibrium price and quantity when:
There is a fall in the price of substitute goods.
Answer the following question.
Show with the help of diagrams, the effect on equilibrium price and quantity when:
There is a rise in the prices of inputs.
Rate of interest on savings account is more than that on recurring account.
