Advertisements
Advertisements
प्रश्न
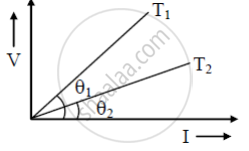
V-I graph for a metallic wire at two different temperatures T1 and T2 is as shown in the figure. Which of the two temperatures is higher and why?

टिप्पणी लिखिए
उत्तर
The slope of the V-I graph gives the resistance of the metallic wire and the slope is higher at temperature T1 and we know that on increasing the temperature of metallic wire resistance of the wire increases, so T1 temperature is higher.
shaalaa.com
V-I Characteristics (Linear and Non-linear)
क्या इस प्रश्न या उत्तर में कोई त्रुटि है?

