Advertisements
Advertisements
प्रश्न
What is the significance of the slope of regression in a species−area relationship?
उत्तर
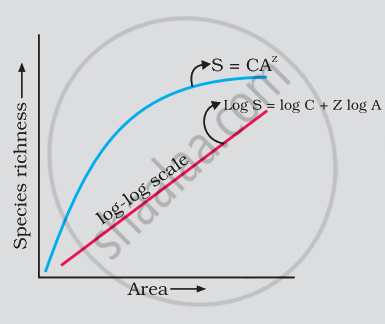
The great German naturalist and geographer Alexander Von Humboldt established the relationship between species richness and area after extensive exploration in the forests of South America. According to him, to some extent the species richness of an area increases with the expansion of the exploration area. The relationship between species richness and the area of wide varieties of taxa is a rectangular hyperbola. It represents a straight line on a logarithmic scale. This relationship can be represented by the following equation –
log S = log C + Z log A
where,
S = species richness, A = area,
Z = slope of the line (regression coefficient)
C = Y-intercept

According to ecologists, the value of Z ranges from 0.1 to 0.2. It does not depend on the taxonomic group or region. Surprisingly, the slopes of the regression line are the same. If we analyse the species-area relations of a large group, such as an entire continent, then it is found that the slope of the regression line is steeply slanted. The range of the value of Z is 0.6 to 1.2.
APPEARS IN
संबंधित प्रश्न
The following graph shows the species - area relationship. Answer the following questions as directed.

(a) Name the naturalist who studied the kind of relationship shown in the graph. Write the observations made by him.
(b) Write the situations as discovered by the ecologists when the value of 'Z'
(Slope of the line) lies between.
(i) 0.1 and 0.2
(ii) 0.6 and 1.2
What does 'Z' stand for?
(c) When would the slope of the line 'b' become steeper?
Explain, giving three reasons, why tropics show greatest levels of species diversity.
The 'rivet' in the rivet popper hypothesis is considered to represent the ______.
Latitudinal and altitudinal gradient is shown by which of the following habitat(s)?
In the equation: log S = log C + Z log A , S= species richness; Z = slope of line (regression coefficient); A = area; C = Y intercept. For smaller area, the value of Z ranges from ____________.
With reference to graph select the correct alternative
All are true regarding graph showing species richness - area relationship, EXCEPT ______.
Which of the following is an observation of Alexander von Humboldt's documented pattern in ecology?
The graph of species richness and area for a number of taxa like angiospermic plants, freshwater fishes, and birds is found to be ______.
Amongst the animal group given below, which one has the highest percentage of endangered species?
The pattern of biodiversity is affected by ______.
Which one of the following is not a major characteristic feature of biodiversity hot spots?
Is it possible that productivity and diversity of a natural community remain constant over a time period of, say one hundred years?
The relation between species richness and area for a wide variety of taxa turns out to be a rectangular hyperbola. Give a brief explanation.
Given below is an equation describing the Species-Area relationship between species richness and area for a wide variety of taxa as angiosperm plants, birds, bats etc. S = CAz
- Give a graphical representation of the given equation showing Species-Area relationship.
- What does 'S' represent in the given equation?
- What is the value of 'Z' (regression coefficient) for frugivorous birds and mammals in the tropical forests of different continents?
The relation between species richness and area for a wide variety of taxa appears as ______.
Alexander von Humboldt observed that, within a region species richness ______ with increasing explored area.
When pre-reproductive and post - reproductive age group is same in structure, the population is______.
