Advertisements
Advertisements
प्रश्न
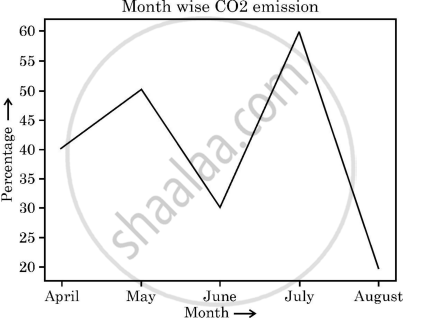
Write suitable Python code to draw the following line chart "\[\ce{CO2}\] Emission" having title and label for X and Y axis as shown below.

Also give suitable Python statement to save this chart with the name, emission.pug.
कोड लेखन
उत्तर
import matplotlib.pyplot as plt
# Data
list1 = {'April', 'May', 'June', 'July', 'August']
list2 = [40, 50, 30, 60, 20]
# Create line chart
plt.plot(list1, list2)
# Add title and labels
plt.title('Month Wise CO2 emission')
plt.xlabel('Month')
plt.ylabel('Percentage')
# Save the chart as fruits.png
plt.savefig(emission.png')
# Show the chart
plt.show()
shaalaa.com
क्या इस प्रश्न या उत्तर में कोई त्रुटि है?
