Topics
Units and Measurements
- Introduction of Units and Measurements
- System of Units
- Measurement of Length
- Measurement of Mass
- Measurement of Time
- Dimensions and Dimensional Analysis
- Accuracy, Precision and Uncertainty in Measurement
- Errors in Measurements
- Significant Figures
Mathematical Methods
- Vector Analysis
- Vector Operations
- Resolution of Vectors
- Multiplication of Vectors
- Introduction to Calculus
Motion in a Plane
- Introduction to Motion in a Plane
- Rectilinear Motion
- Motion in Two Dimensions-Motion in a Plane
- Uniform Circular Motion (UCM)
Laws of Motion
- Introduction to Laws of Motion
- Aristotle’s Fallacy
- Newton’s Laws of Motion
- Inertial and Non-inertial Frames of Reference
- Types of Forces
- Work Energy Theorem
- Principle of Conservation of Linear Momentum
- Collisions
- Impulse of Force
- Rotational Analogue of a Force - Moment of a Force Or Torque
- Couple and Its Torque
- Mechanical Equilibrium
- Centre of Mass
- Centre of Gravity
Gravitation
- Introduction to Gravitation
- Kepler’s Laws
- Newton’s Universal Law of Gravitation
- Measurement of the Gravitational Constant (G)
- Acceleration Due to Gravity (Earth’s Gravitational Acceleration)
- Variation in the Acceleration Due to Gravity with Altitude, Depth, Latitude and Shape
- Gravitational Potential and Potential Energy
- Earth Satellites
Mechanical Properties of Solids
- Introduction to Mechanical Properties of Solids
- Elastic Behavior of Solids
- Stress and Strain
- Hooke’s Law
- Elastic Modulus
- Stress-strain Curve
- Strain Energy
- Hardness
- Friction in Solids
Thermal Properties of Matter
- Introduction to Thermal Properties of Matter
- Heat and Temperature
- Measurement of Temperature
- Absolute Temperature and Ideal Gas Equation
- Thermal Expansion
- Specific Heat Capacity
- Calorimetry
- Change of State
- Heat Transfer
- Newton’s Law of Cooling
Sound
- Introduction to Sound
- Types of Waves
- Common Properties of All Waves
- Transverse Waves and Longitudinal Waves
- Mathematical Expression of a Wave
- The Speed of Travelling Waves
- Principle of Superposition of Waves
- Echo, Reverberation and Acoustics
- Qualities of Sound
- Doppler Effect
Optics
- Introduction to Ray Optics
- Nature of Light
- Ray Optics Or Geometrical Optics
- Reflection
- Refraction
- Total Internal Reflection
- Refraction at a Spherical Surface and Lenses
- Dispersion of Light Through Prism and Formation of Spectrum
- Some Natural Phenomena Due to Sunlight
- Defects of Lenses (Aberrations of Optical Images)
- Optical Instruments
- Optical Instruments: Simple Microscope
- Optical Instruments: Compound Microscope
- Optical Instruments: Telescope
Electrostatics
- Introduction to Electrostatics
- Electric Charges
- Basic Properties of Electric Charge
- Coulomb’s Law - Force Between Two Point Charges
- Principle of Superposition
- Electric Field
- Electric Flux
- Gauss’s Law
- Electric Dipole
- Continuous Distribution of Charges
Electric Current Through Conductors
- Electric Current
- Flow of Current Through a Conductor
- Drift Speed
- Ohm's Law (V = IR)
- Limitations of Ohm’s Law
- Electrical Power
- Resistors
- Specific Resistance (Resistivity)
- Variation of Resistance with Temperature
- Electromotive Force (emf)
- Combination of Cells in Series and in Parallel
- Types of Cells
- Combination of Resistors - Series and Parallel
Magnetism
- Introduction to Magnetism
- Magnetic Lines of Force and Magnetic Field
- The Bar Magnet
- Gauss' Law of Magnetism
- The Earth’s Magnetism
Electromagnetic Waves and Communication System
- EM Wave
- Electromagnetic Spectrum
- Propagation of EM Waves
- Introduction to Communication System
- Modulation
Semiconductors
- Introduction to Semiconductors
- Electrical Conduction in Solids
- Band Theory of Solids
- Intrinsic Semiconductor
- Extrinsic Semiconductor
- p-n Junction
- A p-n Junction Diode
- Basics of Semiconductor Devices
- Applications of Semiconductors and P-n Junction Diode
- Thermistor
Notes
Stress-Strain Curve:

It is a curve between stress and strain.
-
A graph is plotted between the stress (which is equal in magnitude to the applied force per unit area) and the strain produced.
-
The graph helps us to understand how a given material deforms with increasing loads.
-
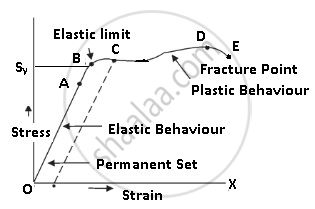
The curve between O and A is a straight line. This means stress is directly ∝ to strain. In this region Hooke’s Law is applicable.
-
In this region, the material behaves like an elastic body.
-
In the region from A to B, stress, and strain are not directly proportional. But still, the material returns to its original dimension after the force is removed. They exhibit elastic properties.
-
The point B in the curve is known as yield point (also known as elastic limit) which means till this point the material will be elastic in behavior and the stress corresponding to point B is known as yield strength (Sy) of the material.
-
The region between O and B is called an Elastic region.
-
From point B to point D, we can see that strain increases rapidly even for a small change in stress.
-
Even if we remove the force the material does not come back to its original position. At this point, stress is zero but the strain is not zero as the body has changed its shape.
-
The material has undergone plastic deformation.
-
The material is said to be a permanent set.
-
The point D on the graph is known as the ultimate tensile strength (Su) of the material.
-
From D to E we can see that stress decreases even if strain increases.
-
Finally at point E fracture occurs. This means the body breaks.
Related QuestionsVIEW ALL [23]
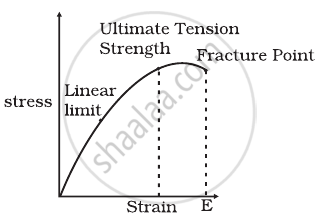
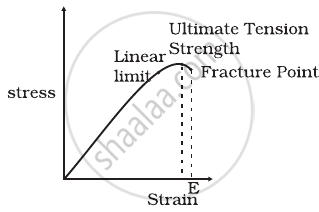
The stress-strain graphs for two materials are shown in figure (assume same scale).
 Material (i) |
 Material (i) |
- Material (ii) is more elastic than material (i) and hence material (ii) is more brittle.
- Material (i) and (ii) have the same elasticity and the same brittleness.
- Material (ii) is elastic over a larger region of strain as compared to (i).
- Material (ii) is more brittle than material (i).

