Advertisements
Advertisements
प्रश्न
______ displays data that changes continuously over periods of time.
उत्तर
Line graph displays data that changes continuously over periods of time.
Explanation:
We have already discussed in the previous question that a line graph displays data that changes continuously over periods of time.
APPEARS IN
संबंधित प्रश्न
Locate the points:
(1, 4), (2, 4), (3, 4), (4, 4).
A point which lies on both the axis is ______.
In the point (2, 3), 3 denotes the y-coordinate.
The coordinates of the origin are (0, 0).
Write the x-coordinate (abscissa) of the given point.
(0, 5)
Locate the points P(3, 4), Q(1, 0), R(0, 4), S(4, 1) on a graph sheet and write the coordinates of the point of intersection of line segments PQ and RS.
The graph given below compares the sales of ice creams of two vendors for a week.

Observe the graph and answer the following questions.
- Which vendor has sold more icecreams on Friday?
- For which day was the sales same for both the vendors?
- On which day did the sale of vendor A increase the most as compared to the previous day?
- On which day was the difference in sales the maximum?
- On which two days was the sales same for vendor B?
Extend the line segment on both sides to meet the coordinate axes. What are the coordinates of the points where this line meets the x-axis and the y-axis?
A man started his journey on his car from location A and came back. The given graph shows his position at different times during the whole journey.
- At what time did he start and end his journey?
- What was the total duration of journey?
- Which journey, forward or return, was of longer duration?
- For how many hours did he not move?
- At what time did he have the fastest speed?

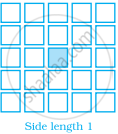
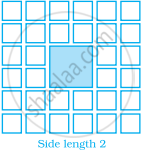
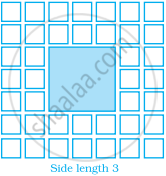
Sonal and Anmol made a sequence of tile designs from square white tiles surrounding one square purple tile. The purple tiles come in many sizes. Three of the designs are shown below.
(a) Copy and complete the table
| Side Length of Purple Titles | 1 | 2 | 3 | 4 | 5 | 10 | 100 |
| Number of white Tiles in Border |
 |
 |
 |
(b) Draw a graph using the first five pairs of numbers in your table.
(c) Do the points lie on a line?
