Advertisements
Advertisements
प्रश्न
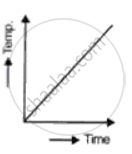
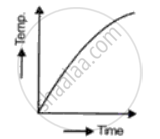
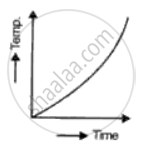
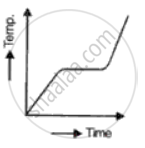
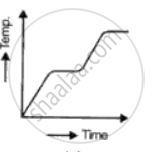
A solid is heated at a constant rate in an insulated container till half of it
vapourises. Which graph in the following fig shows the temperature changes during this time?
पर्याय
MCQ
उत्तर
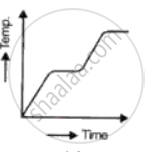
The first time when temperature is constant represents change of state from solid to liquid and the second time temperature is constant represents change of state from liquid to vapour.
shaalaa.com
या प्रश्नात किंवा उत्तरात काही त्रुटी आहे का?
