Advertisements
Advertisements
प्रश्न
A spaceship is moving in space with a velocity of 60 kms−1. It fires its retro engines for 20 seconds and velocity is reduced to 55 kms−1. Calculate the distance travelled by a spaceship in 40 s, from the time of firing of the retro- rockets.
उत्तर
Initial velocity of spaceship = u = 60 kms−1
Final velocity of spaceship = v = 55 kms−1
It decelerates for 20 s
t = 20 s
v = u + at
55 = 60 + a (20)
20a = 55 – 60
20a = −5
a = `(-5)/20`
a = − 0.25
distance travelled in the first 20 sec. = s = u × t − `1/2` a × t2
s = 60 × 20 − `1/2` × 0.25 × 202
= 1200 − `1/2` × 0.25 × 400
= 1200 − `1/2` × 100
= 1200 − 50
= 1,150 km.
After 20 sec. the velocity of the spaceship is constant at 55 km/sec. Hence, the distance travelled is = 55 × 20 = 1,100 km
The total distance travelled in 40 sec. = 1,150 + 1,100 = 2,250 km
APPEARS IN
संबंधित प्रश्न
Show the shape of the distance-time graph for the motion in the following case:
A car parked on a side road.
What can you say about the motion of a body whose distance-time graph is a straight line parallel to the time axis ?
A car is travelling at 20 m/s along a road. A child runs out into the road 50 m ahead and the car driver steps on the brake pedal. What must the car’s deceleration be if the car is to stop just before it reaches the child ?
A body moves along a straight road with a speed of 20 m/s and has a uniform acceleration of 5 m/s2. What will be its speed after 2 s?
Show the shape of the distance – time graph for the motion in the following cases.
- A bus moving with a constant speed.
- A car parked on a road side.
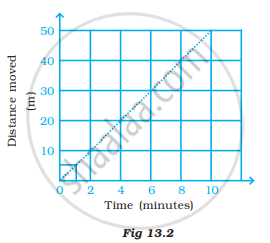
Two students were asked to plot a distance-time graph for the motion described in Table A and Table B.
Table A
| Distance moved (m) | 0 | 10 | 20 | 30 | 40 | 50 |
| Time (minutes) | 0 | 2 | 4 | 6 | 8 | 10 |
Table B
| Distance moved (m) | 0 | 5 | 10 | 15 | 20 | 25 |
| Time (minutes) | 0 | 1 | 2 | 3 | 4 | 5 |

The graph given in Figure 13.2 is true for
If we denote speed by S, the distance by D and time by T, the relationship between these quantities is
Complete the data of the table given below with the help of the distance-time graph given in Figure 13.6
| Distance (m) | 0 | 4 | ? | 12 | ? | 20 |
| Time (s) | 0 | 2 | 4 | ? | 8 | 10 |

The slope of the distance-time graph indicates the speed.
What do you infer if
- Distance – time graph is a straight line.
- The velocity-time graph is curved.
- Displacement time is zigzag.
