Advertisements
Advertisements
प्रश्न
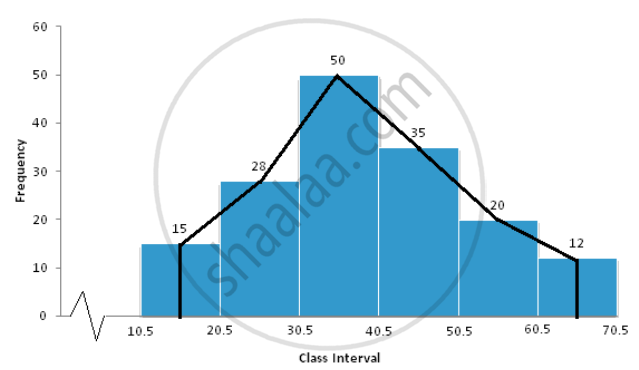
Construct a histogram and then a frequency polygon for the following frequency distribution.
| Class Interval | 11-20 | 21-30 | 31-40 | 41-50 | 51-60 | 61-70 |
| Frequency | 15 | 28 | 50 | 35 | 20 | 12 |
उत्तर
1. Organize the data into equal intervals by subtracting 0.5 from lower limit of each class and add 0.5 to the upper limit of each class .
2. On the x-axis , take 1 cm as 5 units and plot class interval .
3. On the y-axis , take 1 cm as 5 units and plot frequency.
4. Draw rectangles of histogram as per given data.
5. For each rectangle , mark the midpoint of its length at the top part . In this case , points are (15.5,15),(25.5,28),(35.5,50),(45.5,35),(55.5,20),(65.5,12).
6. Mark two more midpoints of zero frequency on x-axis at the start and at the end .
7. Now connect the points using straight lines.
| Class Interval | Frequency |
| 10.5-20.5 | 15 |
| 20.5-30.5 | 28 |
| 30.5-40.5 | 50 |
| 40.5-50.5 | 35 |
| 50.5-60.5 | 20 |
| 60.5-70.5 | 12 |

APPEARS IN
संबंधित प्रश्न
(Use a graph paper for this question.) The daily pocket expenses of 200 students in a school are given below:
| Pocket expenses (in Rs.) | Number of students (Frequency) |
| 0-5 | 10 |
| 5-10 | 14 |
| 10-15 | 28 |
| 15-20 | 42 |
| 20-25 | 50 |
| 25-30 | 30 |
| 30-35 | 14 |
| 35-40 | 12 |
Draw a histogram representing the above distribution and estimate the mode from the graph.
Draw a histogram and hence estimate the mode for the following frequency distribution:
| Class | 0-5 | 5-10 | 10-15 | 15-20 | 20-25 | 25-30 |
| Freq | 0 | 7 | 18 | 10 | 8 | 5 |
Construct a histogram and then a frequency polygon for the following frequency distribution.
| Class Interval | 0-10 | 10-20 | 20-30 | 30-40 | 40-50 | 50-60 |
| Frequency | 8 | 13 | 27 | 35 | 14 | 3 |
Construct a histogram and then a frequency polygon for the following frequency distribution.
| Class Interval | 100-150 | 150-200 | 200-250 | 250-300 | 300-350 |
| Frequency | 10 | 15 | 17 | 12 | 10 |
A Mathematics aptitude test of 50 students was recorded as follows:
| Marks | No. of Students |
| 50 - 60 | 4 |
| 60 - 70 | 8 |
| 70 - 80 | 14 |
| 80 - 90 | 19 |
| 90 - 100 | 5 |
Draw a histogram for the above data using a graph paper and locate the mode.
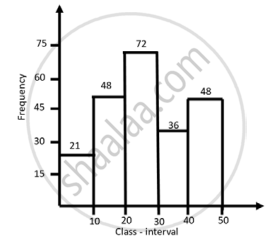
In the given graph, the modal class is the class with frequency:

The following distribution gives the daily wages of 60 workers of a factory.
| Daily income in ₹ |
Number of workers (f) |
| 200 – 300 | 6 |
| 300 – 400 | 10 |
| 400 – 500 | 14 |
| 500 – 600 | 16 |
| 600 – 700 | 10 |
| 700 – 800 | 4 |
Use graph paper to Solution this question.
Take 2 cm = ₹ 100 along one axis and 2 cm = 2 workers along the other axis.
Draw a histogram and hence find the mode of the given distribution.
