Advertisements
Advertisements
प्रश्न
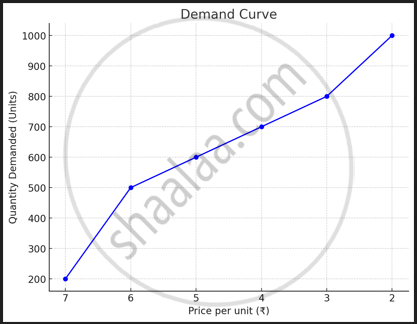
Draw a demand curve on the basis of the following data.
| Price per unit (₹) | 2 | 3 | 4 | 5 | 6 | 7 |
| Quantity demanded (Units) | 1000 | 800 | 700 | 600 | 500 | 200 |
उत्तर
APPEARS IN
संबंधित प्रश्न
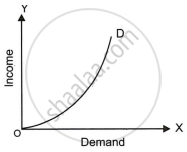
What does the graph below indicate?
Assertion (A): If the income of a consumer increases, other things constant, the demand curve for a normal goods shifts to the right.
Reason (R): As income increases, the demand curve for an inferior good shifts to the left.
Draw a neat labelled diagram of a demand curve.
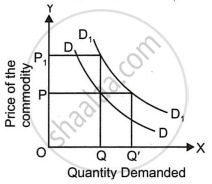
What does the demand curve given below show?
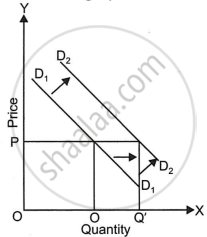
Explain the following diagram:
Give two reasons for the shift of the demand curve towards the left.
Give two reasons for the shift of the demand curve towards the right.
In 2002, the prices of gold nearly tripled. yet, as the price of gold rose its sales too increased. Does this mean that the demand curve for gold is upward sloping? Justify your answer.
Does a demand curve always have a negative slope? Give three reasons to justify your answer.
With the help of a diagram, show how a market demand curve can be obtained from individual demand curves.
