Advertisements
Advertisements
प्रश्न
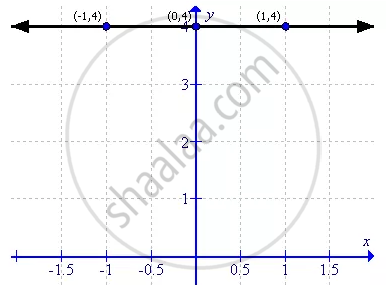
Draw the graph for the linear equation given below:
y = 4
उत्तर
First, prepare a table as follows:
| x | - 1 | 0 | 1 |
| y | 4 | 4 | 4 |
Thus the graph can be drawn as follows:
APPEARS IN
संबंधित प्रश्न
The following table gives production yield in kg per hectare of wheat of 100 farms of a village :
| Production yield (kg/hectare) : |
40−45 | 45−50 | 50−55 | 55−60 | 60−65 | 65−70 |
| Number of farms | 4 | 6 | 16 | 20 | 30 | 24 |
Change the distribution to a 'more than type' distribution, and draw its ogive.
Draw the graph for the linear equation given below:
x = 3
Draw the graph for the linear equation given below:
x + 3 = 0
Draw the graph for the linear equation given below:
y + 6 = 0
Draw the graph for the linear equation given below:
y = 0
Draw the graph for the equation given below:
2x - 5y = 10
For the pair of linear equations given below, draw graphs and then state, whether the lines drawn are parallel or perpendicular to each other.
y = x - 3
y = - x + 5
Draw a graph of each of the following equations: 5x + 2y = 16
Draw a graph of each of the following equations: x = -3y
Draw a graph of each of the following equations: `(x - 2)/(3) - (y + 1)/(2)` = 0
