Advertisements
Advertisements
प्रश्न
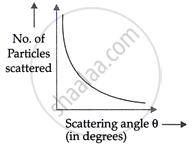
Draw the graph showing variation of scattered particles detected (N) with the scattering angle (θ) in Geiger-Marsden experiment. Write two conclusions that you can draw from this graph. Obtain the expression for the distance of closest approach in this experiment.
उत्तर

Two conclusions from the graph:
- Most α-particles pass through the gold foil with minimal deflections.
- Approximately 1 in 8000 α-particles are deflected at 90° or more angles.
- Occasionally, an α-particle rebounded from the gold foil and deflected approximately 180°.
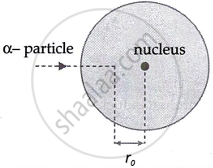
Expression for the distance of the closest approach:

The distance of the closest approach refers to the distance between a charged particle and the nucleus centre, where the particle's initial kE is changed into the system's electric potential (pE).
Charge on the α-particle q1 = +2e
Charge on the nucleus q2 = +Ze
Initial kE of the α-particle kα = `1/2 mv^2`
Electrostatic pE of α-particle and nucleus at r0,
`U = k(q_1q_2)/r_0 = k(2e*Ze)/r_0`
Now kα = U
⇒ `1/2mv^2 = k(2Ze^2)/r_0`
⇒ `r_0 = (2kZe^2)/k_alpha = (4kZe^2)/(mv^2)`
Where `k = 1/(4piepsilon_0) = 9 xx 10^9NM^2C^-2`
