Advertisements
Advertisements
प्रश्न
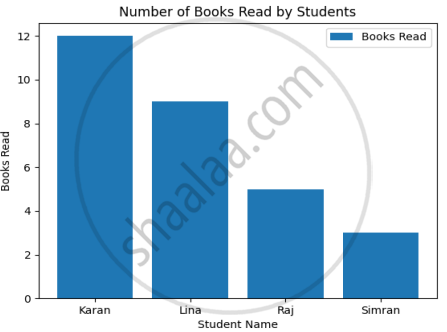
During a practical exam, a student Ankita has to fill in the blanks in a Python program that generates a bar chart. This bar chart represents the number of books read by four students in one month.
| Student Name | Books Read |
| Karan | 12 |
| Lina | 9 |
| Raj | 5 |
| Simran | 3 |
Help Ankita to complete the code.

import _____ as plt #Statement-1
students = ['Karan', 'Lina', 'Raj', 'Simran']
books_read = [12, 9, 5, 3]
plt.bar( students, _____, label='Books Read') #Statement-2
plt.xlabel('Student Name')
plt._____('Books Read') #Statement-3
plt.legend()
plt.title('_____') #Statement-4
plt.show()
- Write the suitable code for the import statement in the blank space in the line marked as Statement-1.
- Refer to the graph shown above and fill in the blank in Statement-2 with suitable Python code.
- Fill in the blank in Statement-3 with the name of the function to set the label on the y-axis.
- Refer the graph shown above and fill the blank in Statement-4 with suitable Chart Title.
कोड लेखन
रिकाम्या जागा भरा
उत्तर
import matplotlib.pyplot as plt #Statement-1
students = ['Karan', 'Lina', 'Raj', 'Simran']
books_read = [12, 9, 5, 3]
plt.bar( students, books_read, label='Books Read') #Statement-2
plt.xlabel('Student Name')
plt.ylabel ('Books Read') #Statement-3
plt.legend()
plt.title('Number of Books Read by Students') #Statement-4
plt.show()
shaalaa.com
या प्रश्नात किंवा उत्तरात काही त्रुटी आहे का?
