Advertisements
Advertisements
प्रश्न
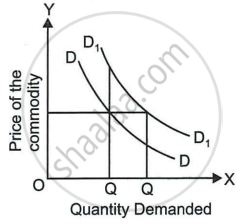
Explain the following diagram:
उत्तर
The diagram above shows a change in the demand curve to the left. From the demand curve D1D1 to DD, a decline in quantity is caused by a change in market conditions rather than a change in its own price. At the same price P, demand was initially Q1 quantity but eventually decreased to Q.
APPEARS IN
संबंधित प्रश्न
With the help of a graph explain the increase in demand concept.
Differentiate between extension and contraction of demand.
When the demand curve of a product shifts to the right, it represents a situation of ______.
What is a decrease in demand?
With the help of a suitable diagram, distinguish between a change in quantity demanded and a change in demand.
What is meant by an increase in demand?
What causes an upward movement along a demand curve?
The following table shows a change in the demand. Read the table carefully and answer the question that follows:
| Case I | Case II | ||
| Price (₹) | Quantity | Price (₹) | Quantity |
| 10 | 20 | 10 | 20 |
| 10 | 10 | 5 | 20 |
What type of change is it, decrease in demand or contraction in demand? Give a reason.
State whether the following statement is true or false. Give reasons.
An increase in the demand for a commodity is due to a fall in its price.
State whether the following statement is true or false. Give reasons.
Contraction of demand is the result of a decrease in the number of consumers.
