Advertisements
Advertisements
प्रश्न
Explain with reasons the method which is best suited to show the distribution of population in a region.
उत्तर
Population refers to the number of people residing in a clearly demarcated geographic area. Often, for study, this demarcated area is based on administrative divisions. Thus, the number of people living at a given time in a country, state, district, village, etc., refers to the area's population. Two types of thematic maps can be used to show the population distribution of any given site. These are dot distribution maps and choropleth maps.
- Dot distribution maps - Uses dots to represent pre-calculated values of the chosen variable. The value of each dot is calculated based on the highest and lowest recorded population data. The beads used should be uniform in size, corresponding to their index. Dot placement depends on natural and artificial features like rivers, roads, etc. This method makes it easy to read maps and allows for a precise interpretation of population distribution in a given area. But with the increasing density of dots, the map loses its efficiency.
- Choropleth maps - Shades of the same colour or other colours represent the population data for different geographical areas. Every sub-administrative region has one assigned value. Data is divided into classes after ascertaining the highest and lowest matters; each class gets a particular shade. The shade becomes darker with the increasing importance of the given variables. Administrative boundaries play a vital role in this form of maps. Since classes are used for data division, population density is often represented through these maps.
From the above discussion, it is evident that dot distribution maps are ideal for representing the population distribution of an area, as administrative boundaries define the data collected. Choropleth maps should be used only with intensity to convey a clearer picture.
APPEARS IN
संबंधित प्रश्न
Give reasons why following sentence is right or wrong:
The main aim of distributional maps is to show location.
Give reasons why following sentence is right or wrong:
In dot method, every dot should have an appropriate scale.
Give reasons why following sentence is right or wrong:
Distribution of various geographical elements can be shown using dot method.
Which method will you use for the following information?
Talukawise wheat production in the district
Which method will you use for the following information?
Distribution of domestic animals in the State.
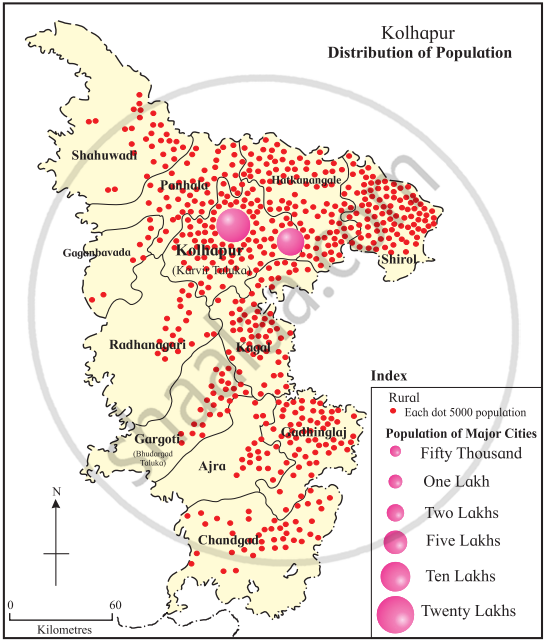
Study the population distribution map of Kolhapur district and answer the following questions:
- Which method has been used to show the distribution of population in the district?
- Explain the directionwise distribution of the population from dense to sparse.
- What is the population shown by the largest circle? Which place is that?
- Which Taluka has the least population?

Now we will prepare a map using dot method. Carry out the following activity.
- See the map of Nandurbar given in fig. carefully. Draw it on another paper or tracing paper along with its taluka and district boundaries.
- Now see the population table given along the map. On the basis of the statistical data, decide the value of the dots considering the highest and the lowest values of population. For example, 1 dot = 10000 people, so you can decide how many dots to be given to each sub-administrative unit.
- To draw dots of the uniform size, take a ball pen refill. Close the back end of the refill with cotton. Press this end on a stamp-pad and draw the imprints of the dots wherever required.
- While placing the dots, consider the physiography, water sources, roads, rails, taluka and district headquarters as shown in the map in fig
- Compare your dot map with other students and arrange a discussion in the class

| S.No. | Talukas | Rural Population 2011 |
| 1. | Akkalkuwa | 2,15,974 |
| 2. | Akrani | 1,89,661 |
| 3. | Taloda | 1,33,291 |
| 4. | Shahada | 3,46,352 |
| 5. | Nandurbar | 2,56,409 |
| 6. | Nawapur | 2,31,134 |
