Advertisements
Advertisements
प्रश्न
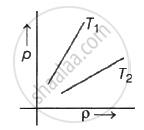
Figure shows graph of pressure versus density for an ideal gas at two temperature T1 and T2.
पर्याय
T1 > T2
T1 = T2
T1 < T2
any three is possible
MCQ
उत्तर
T1 > T2
Explanation:
As we know,
ideal gas equation,
PV = nRT ; P = wRT/MV = dRT/M
PM = dRT
∴ P ∝ d .T
So, T1 > T2
shaalaa.com
या प्रश्नात किंवा उत्तरात काही त्रुटी आहे का?
