Advertisements
Advertisements
प्रश्न
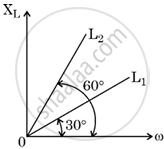
Figure shows the variation of inductive reactance XL of two ideal inductors of inductance L1 and L2, with angular frequency o. The value of `L_1/L_2` is:

पर्याय
`sqrt3`
`1/sqrt3`
3
`1/3`
MCQ
उत्तर
`bb(1/3)`
Explanation:
The inductance value is indicated by the slope of the graph between the inductive reactance XL and the angular frequency (ω). Additionally, the slope can be found using tan θ, where θ is the angle formed by the slope of the XL - ω graph and (ω). Based on the graph,
`L_1 = tan 30^\circ = 1/sqrt3`
and `L_2 = tan 60^\circ = sqrt3`
So, `L_1/L_2 = (1/sqrt3)/sqrt3 = 1/3`
shaalaa.com
या प्रश्नात किंवा उत्तरात काही त्रुटी आहे का?
