Advertisements
Advertisements
प्रश्न
For the curve y = `x^((1/3))` given in Figure 1.68, draw
y = `- x^((1/3))`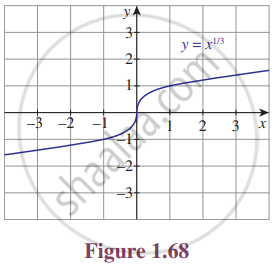
उत्तर
y = `- x^((1/3))`
– y = `x^((1/3))`
(– y)3 = x
– y3 = x
When y = 0 ⇒ – 03 ⇒ x = 0
y = 1 ⇒ – 13 = x ⇒ x = – 1
y = 2 ⇒ – 23 = x ⇒ x = – 8
y = 3 ⇒ – 33 = x ⇒ x = – 27
y = – 1 ⇒ – (– 1)3 = x ⇒ x = 1
y = – 2 ⇒ – (– 2)3 = x ⇒ x = 8
y = – 3 ⇒ – (– 3)3 = x ⇒ x = 27
| x | 0 | – 1 | – 8 | – 27 | 1 | 8 | 27 |
| y | 0 | 1 | 2 | 3 | – 1 | – 2 | – 3 |
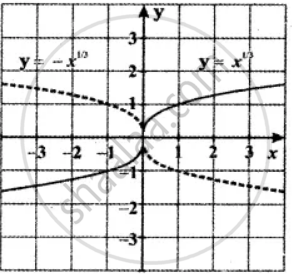
The graph of y = `- x^((1/3))` is the reflection of the graph of y = `x^((1/3))`about the x-axis.
The graph of y = – f(x) is the reflection of the graph of y = f(x) about x – axis.
APPEARS IN
संबंधित प्रश्न
For the curve y = x3 given in Figure 1.67, draw
y = −x3 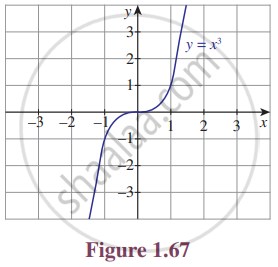
For the curve y = x3 given in Figure 1.67, draw
y = x3 − 1
For the curve y = x3 given in Figure 1.67, draw
y = (x + 1)3 with the same scale
For the curve y = `x^((1/3))` given in Figure 1.68, draw
y = `x^((1/3)) + 1`
For the curve y = `x^((1/3))` given in Figure 1.68, draw
y = `x^((1/3)) - 1`
For the curve y = `x^((1/3))` given in Figure 1.68, draw
y = `(x + 1)^((1/3))`
Write the steps to obtain the graph of the function y = 3(x − 1)2 + 5 from the graph y = x2
From the curve y = sin x, graph the function.
y = sin(− x)
From the curve y = sin x, graph the function
y = `sin(pi/2 + x)` which is cos x
From the curve y = x, draw y = − x
From the curve y = x, draw y = 2x
From the curve y = x, draw 2x + y + 3 = 0
From the curve y = |x|, draw y = |x − 1| + 1
From the curve y = |x|, draw y = |x + 1| − 1
From the curve y = |x|, draw y = |x + 2| − 3
