Advertisements
Advertisements
प्रश्न
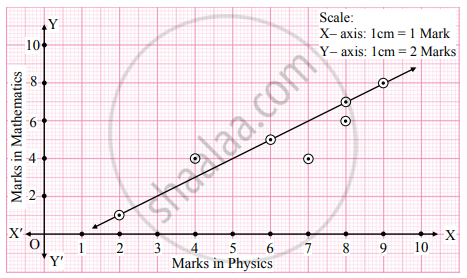
For the following data of marks of 7 students in physics (x) and Mathematics (y), draw scatter diagram and state the type of correlation.
| x | 8 | 6 | 2 | 4 | 7 | 8 | 9 |
| y | 6 | 5 | 1 | 4 | 4 | 7 | 8 |
आकृती
उत्तर
We take marks in Physics on X-axis and marks in Mathematics on Y-axis and plot the points as below.

We get a band of points rising from left to right. This indicates the positive correlation between marks in Physics and marks in Mathematics.
shaalaa.com
या प्रश्नात किंवा उत्तरात काही त्रुटी आहे का?
APPEARS IN
संबंधित प्रश्न
Draw scatter diagram for the data given below and interpret it.
| x | 10 | 20 | 30 | 40 | 50 | 60 | 70 |
| y | 32 | 20 | 24 | 36 | 40 | 28 | 38 |
Draw scatter diagram for the data given below. Is there any correlation between Aptitude score and Grade points?
| Aptitude score | 40 | 50 | 55 | 60 | 70 | 80 |
| Grade points | 1.8 | 3.5 | 2.8 | 1.7 | 2.8 | 3.2 |
