Advertisements
Advertisements
प्रश्न
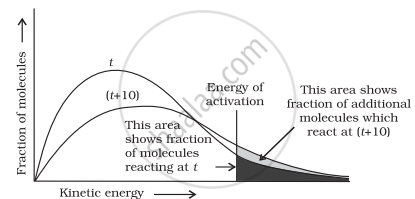
In the graph showing Maxwell Boltzman distribution of energy:
(i) area under the curve must not change with increase in temperature.
(ii) area under the curve increases with increase in temperature.
(iii) area under the curve decreases with increase in temperature.
(iv) with increase in temperature curve broadens and shifts to the right hand side.
टीपा लिहा
उत्तर
(i) area under the curve must not change with increase in temperature.
(iv) with increase in temperature curve broadens and shifts to the right hand side.
Explanation:
Area under the curve remains same with increase in temperature and with increase in temperature curve broadens and shifts to the right-hand side.
shaalaa.com
या प्रश्नात किंवा उत्तरात काही त्रुटी आहे का?
