Advertisements
Advertisements
प्रश्न
List the attributes that populations but not individuals possess.
उत्तर
There are some such characteristics in a population which are not found in an individual. For example, an individual is born and dies, but a population has a birth rate and a death rate. In a population, these rates are called birth rate and death rate per individual respectively. Birth and death rates are expressed as the increase or decrease in the number of members of the population. For example, if there were 20 water lily plants in a pond last year and this year 8 more plants are formed through reproduction, then at present the population becomes 28, then we calculate the reproduction rate at the rate of 8/20 = 0.4 offspring per water lily. If in a laboratory population, out of 50 fruit flies, 5 individuals perish in a particular interval (e.g. one week), then the death rate in the population in this interval will be called 5/50 = 0.1 individual per fruit fly per week. The second characteristic of the population is the sex ratio, i.e. the ratio of males and females. Generally this ratio in a population is 50:50, but it can also vary, for example, there are 60 percent females and 40 percent males in a population. In a given time, a population is made up of individuals of different ages. If the age distribution of the members of the population is plotted, then the structure formed by this is called an age pyramid. The shape of the pyramids reflects the condition of the population.
- whether it is growing
- stable or
- declining

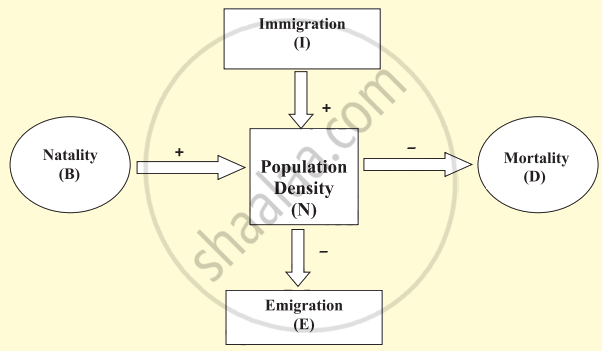
The size of a population explains its position in the habitat. It is affected by intraspecific, interspecific competition, pesticides, environmental factors etc. In technical language, it is explained as population density. Population density is estimated in various ways. Population density (size) is not fixed for any species. It keeps changing from time to time. The reason for this is the amount of food, the difference in conditions, predation, etc. The growth of a population depends on four factors birth rate and immigration increase the population, while death rate and emigration decrease it. If the initial population is No, Nt is a time interval and I is the subsequent population, then
Nt = No + (B + I) – (D + E)
= No + B + 1 – D – E
The equation clearly shows that if the number of people born ‘B’ + number of immigrants ‘I’ (B + I) is more than the number of people dying ‘D’ + number of emigrants ‘E’, then the population density will increase; otherwise, it will decrease.
APPEARS IN
संबंधित प्रश्न
Study the graph given below and answer the questions that follow :
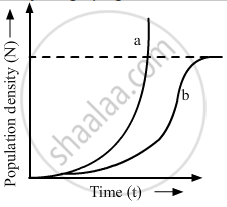
(i) Write the status of food and space in the curves (a) and (b).
(ii) In the absence of predators, which one of the two curves would appropriately depict the prey population?
(iii) Time has been shown on X-axis and there is a parallel dotted line above it. Give the significance of this dotted line
Define population
What is an age-pyramid?
Study the flow chart given below and complete the equation that follows by identifying 1, 2, 3 and 4.
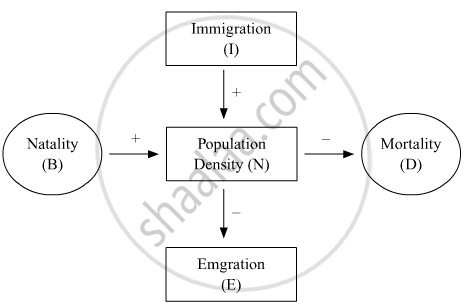
Nt + 1 = Nt + {(1+ 2) − (3 + 4)}
Give an account of population regulation.
Nutrient enrichment of water body result.
The phenomenal and rapid increase of population in a short period is called ______.
Population having large number of postreproductive and small number of prereproductive age group is called
`"dN"/"dt" = "rN" (("K"- "N")/"K")` in logistic growth "K" represents:
The density of a population in a habitat per unit area is measured in different units. Write the unit of measurement against the following:
Banyan
The density of a population in a habitat per unit area is measured in different units. Write the unit of measurement against the following:
Deer
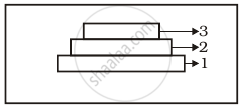
Label the three tiers 1, 2, 3 given in the above age pyramid.
Define ‘zero population growth rate’. Draw a age pyramid for the same.
An individual and a population has certain characteristics. Name these attributes with definitions.
Given below is the Age Pyramid of the population in one of the states in India as per 2011 census. It depicts the male population on the left-hand side, female population on the right-hand side, newborns towards the base and gradually increasing age groups as we move from base to the top, with the oldest population at the top. Study this pyramid and comment upon the appropriateness of the Assertion and the Reason.
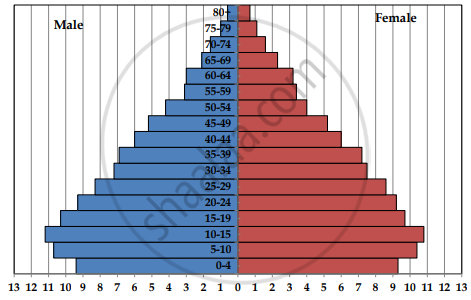
Percentage to the total population
Assertion: It is a stable population.
Reason: The pre-reproductive and reproductive individuals are almost in equal numbers and the post-reproductive individuals are relatively fewer.
Important attributes belonging to a population but not to an individual are:
- Birth rate and death rate
- Male and female
- Birth and death
- Sex-ratio
Select the correct option from the given options:
The number of lily plants in a pond was found to be 50. After one year, the number. increased to 65. Calculate the natality of lily plants.
