Advertisements
Advertisements
प्रश्न
Range of the data is always from the data.
पर्याय
True
False
उत्तर
This statement is False.
Explanation:
The difference between the highest and lowest observations in a given data is called its range.
APPEARS IN
संबंधित प्रश्न
Find the range of heights of any ten students of your class.
The marks (out of 100) obtained by a group of students in a science test are 85, 76, 90, 85, 39, 48, 56, 95, 81 and 75. Find the:
- Highest and the lowest marks obtained by the students.
- Range of the marks obtained.
- Mean marks obtained by the group.
The heights of 10 girls were measured in cm and the results are as follows:
135, 150, 139, 128, 151, 132, 146, 149, 143, 141
- What is the height of the tallest girl?
- What is the height of the shortest girl?
- What is the range of the data?
- What is the mean height of the girls?
- How many girls have heights more than the mean height.
The difference between the highest and the lowest observations in a data is its ______.
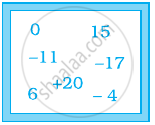
Some integers are marked on a board. What is the range of these integers?
The range of the data 3, 7, 1, –2, 2, 6, –3, –5 would change if 8 was added to each value in the data.
The marks in a subject for 12 students are as follows:
31, 37, 35, 38, 42, 23, 17, 18, 35, 25, 35, 29
For the given data, find the range
Given below are heights of 15 boys of a class measured in cm:
128, 144, 146, 143, 136, 142, 138, 129, 140, 152, 144, 140, 150, 142, 154
Find the height of the tallest boy.
Given below are heights of 15 boys of a class measured in cm:
128, 144, 146, 143, 136, 142, 138, 129, 140, 152, 144, 140, 150, 142, 154.
Find the height of the shortest boy.
Age (in years) of 6 children of two groups are recorded as below:
| Age (in Years) | |
| Group A | Group B |
| 7 | 7 |
| 7 | 9 |
| 9 | 11 |
| 8 | 12 |
| 10 | 12 |
| 10 | 12 |
- Find the mode and range for each group.
- Find the range and mode if the two groups are combined together.
