Advertisements
Advertisements
प्रश्न
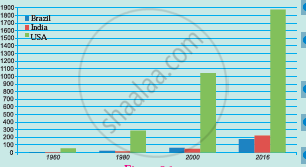
Read the following graph and answer the questions:
- Which country’s national income was highest in 2016 and was it how much?
- Comparing India and Brazil, which country had a higher national income in 1980?
- Comparing India and Brazil, which country had a higher income in 2016?
- Tell the difference between the GNP of Brazil and India in 2016.
- Calculate the difference between the national incomes of developed and developing countries in 2016.
उत्तर
a. National income is the money value of all the final goods and services produced within the domestic territory of the country during a particular period of time, generally within a year. In 2016, the national income of the US was the highest. It was nearly 1900 million US dollars.
b. National income is the money value of all the final goods and services produced within the domestic territory of the country during a particular period of time, generally within a year. In 1980, Brazil had a higher national income compared to India. The difference between their incomes is only negligible.
c. National income is the money value of all the final goods and services produced within the domestic territory of the country during a particular period of time, generally within a year. In 2016, India had a higher national income compared to Brazil. The national income of India has just crossed 200 million US dollars, while the national income of Brazil is reaching 200 million US dollars.
d. National income is the money value of all the final goods and services produced within the domestic territory of the country during a particular period of time, generally within a year. In 2016, India had a higher national income compared to Brazil. The national income of India has just crossed 200 million US dollars, while the national income of Brazil is reaching 200 million US dollars.
e. National income is the money value of all the final goods and services produced within the domestic territory of the country during a particular period of time, generally within a year. The US is a developed economy while both Brazil and India are developing countries. There is a huge gap between the national incomes of both developed and developing countries. In 2016, the US had a national income of nearly 1900 million US dollars, but the national income of India has just crossed 200 million US dollars. There exists a huge gap between the two amounting to about 1700 million US dollars.
APPEARS IN
संबंधित प्रश्न
Between India and Brazil, whose per capita income is less?
B) Read the following graph and answer the questions :

i) In which country is the contribution of tertiary sector higher ?
ii) In India, most people are engaged in which occupational sector?
iii) Which country has only 10% of the population engaged in primary sector?
iv) How much does tertiary sector contribute to the national income of India?
v) Which sector contributes the least in the Brazilian national income?
vi) What is the percentage of people engaged in the secondary sector in Brazil?
State whether the sentence is right or wrong and correct the wrong ones and rewrite the sentence
Like the Indian economy, the Brazilian economy is also of mixed type.
Give reason.
Per capita land availability is more in Brazil as compared to India.
Give reason.
There is mixed economy in Brazil and India.
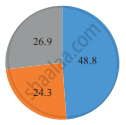
With the help of the pie chart given in fig tell what is the contribution of secondary activities in Brazil's GDP?

Distinguish Between
Occupations in India and Brazil
Per capita income of India is less than Brazil.
A table regarding the ownership of various sectors in both the countries is given. Like Brazil, fill the details regarding India and complete the table.
| Sr.No. | India | Sector | Brazil |
| 1. | -- | Banking | Private and public both |
| 2. | -- | Railways | Private and public both |
| 3. | -- | Airways | Private and public both |
| 4. | -- | Electricity production | Largely public |
| 5. | -- | Iron and Steel Industry | Largely public |
| 6. | -- | Health | Private and public both |
| 7. | -- | Education | Largely public, little private |
| 8. | -- | Telecommuni-cations | Private and public both |
- On the basis of the information about the ownership of various sectors in both the countries given in the table, can you infer about the type of these economies?
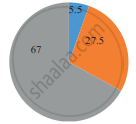
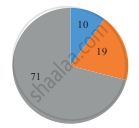
In figure given below, the pie-charts show the contribution of each sector in the respective country’s GDP and the percentage of population engaged in various activities. Read both the pie-charts carefully and answer the following questions.
| Brazil | India |
 |
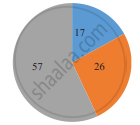 |
| Contribution of sectors in GDP (2016) | |
 |
 |
| Percentage of population engaged in various sectors (2016) | |
 Primary Primary  Secondary Secondary  Tertiary Tertiary |
|
- Which country has a higher percentage of population engaged in primary activities?
- In which country is the contribution of tertiary sector greater in the GDP?
- In which country is the share of secondary activities more in the GDP?
- Can we say that Brazil is an agrarian economy like India? Give reasons.
