Advertisements
Advertisements
प्रश्न
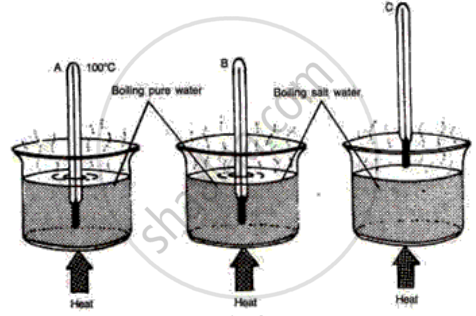
The following diagrams illustrate three situations involving thermometers which are labeled A, Band C. In each situation the thermometers indicate different readings.
(i) What do you expect the approximate reading of the thermometer B and C would be? Give a reason for your answer.
(ii) How would the readings of A and B help you in calibrating a thermometer?

उत्तर

(i) The temperature of steam and boiling water Is equal so the reading of thermometer is the same. But due to the addition of salt boiling point of water elevates so the reading of thermometer would be slightly higher than the boiling point of water i.e 100° C.
(ii) The addition of salt boiling point of water increases so thermometer has to measure temperature for a wider range and thus it helps in the calibration of the thermometer.
APPEARS IN
संबंधित प्रश्न
1 kg of ice at 0°C is mixed with 1 kg of steam at 100°C. What will be the composition of the system when thermal equilibrium is reached? Latent heat of fusion of ice = 3.36 × 10³ J kg−1 and latent heat of vaporization of water = 2.26 × 10⁶ J kg−1.
Explain, why does a glass bottle completely filled with water and tightly capped burst when placed in a freezer?
Explain, why are the exposed water pipes lagged with straw during severe winter?
What are hot spots? How can you extract energy from a hot spot, if it does not come in contact with underground water?
Write the name.
The instrument used to study anomalous behaviour of water.
Draw a neat and labelled diagram of Hope’s apparatus.
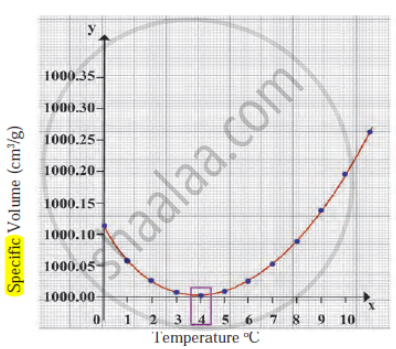
Observe the following diagram and write the answers to the questions given below.

- Which process does the graph represent?
- What is the range of temperature responsible for the behaviour?
Write a short note.
Anomalous behaviour of water
Match the columns:
| Column ‘A’ | Column ‘B’ |
| The density of water is maximum at | (a) 0°C |
| (b) 4°C | |
| (c) 100°C |
