Advertisements
Advertisements
प्रश्न
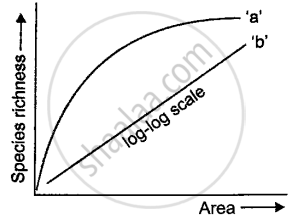
Study the graph given below and answer the following questions:

- Explain the ecological principle represented by the graph and write a mathematical expression for the same.
- What will happen if the slope of the line ‘b’ becomes steeper?
उत्तर
(i) German naturalist and geographer Alexander Von Humboldt observed that within a region, species richness increases with increasing explored area but only up to a limit.
The relation between species richness and area for a wide variety of taxa turns out to be a rectangular hyperbola. On a logarithmic scale, the relationship is a straight line described by the equation:
logs = loge + z logA
Where S = species richness, A = area, Z = slope of the line [regression coefficient] C = Y-axis intercept.
(ii) The slope of the line 'b' becomes steeper when very large areas such as continents are considered for species-area relationship.
[here Z value is in the range of 0.6 to 1.2]
APPEARS IN
संबंधित प्रश्न
Explain the importance of biodiversity hot-spots and sacred groves.
Discuss briefly the importance of animals to human kind.
What are the roles played by biodiversity in the shaping of nature?
Which of these is a FALSE statement with regards to characteristics of a stable community?
'The Evil Quartet' refers to ______.
