Advertisements
Advertisements
प्रश्न
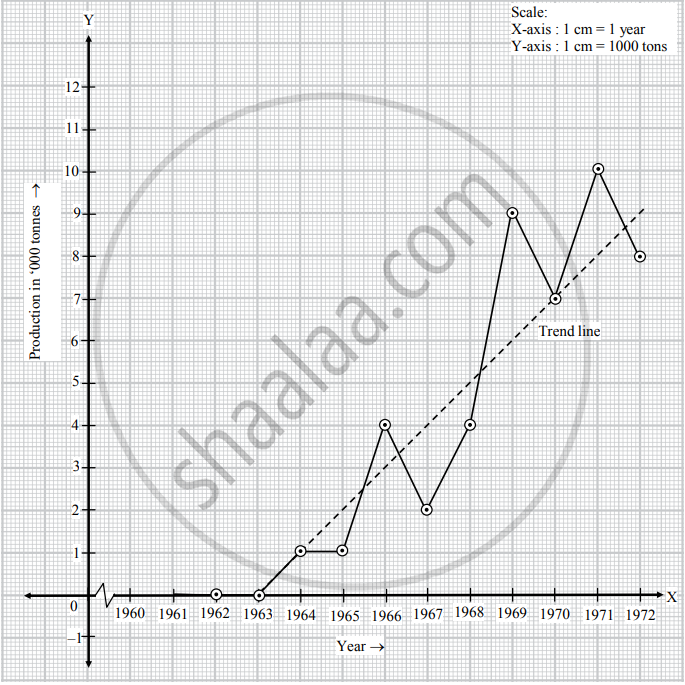
The following data gives the production of bleaching powder (in '000 tons) for the years 1962 to 1972.
| Year | 1962 | 1963 | 1964 | 1965 | 1966 | 1967 | 1968 | 1969 | 1970 | 1971 | 1972 |
| Production | 0 | 0 | 1 | 1 | 4 | 2 | 4 | 9 | 7 | 10 | 8 |
Fit a trend line by graphical method to the above data.
उत्तर
Taking year on X-axis and production on Y-axis, we plot the points for production corresponding to the years. Joining the points by straight lines, we get the graph for the given time series. We draw trend line as shown in the figure.
APPEARS IN
संबंधित प्रश्न
The following table shows the index of industrial production for the period from 1976 to 1985, using the year 1976 as the base year.
| Year | 1976 | 1977 | 1978 | 1979 | 1980 | 1981 | 1982 | 1983 | 1984 | 1985 |
| Index | 0 | 2 | 3 | 3 | 2 | 4 | 5 | 6 | 7 | 10 |
Fit a trend line to the above data by graphical method.
Choose the correct alternative :
The first step in time series analysis is to _______.
Choose the correct alternative :
Time-series analysis is based on the assumption that _______.
Fill in the blank :
The graph of time series clearly shows _______of it is monotone.
