Advertisements
Advertisements
प्रश्न
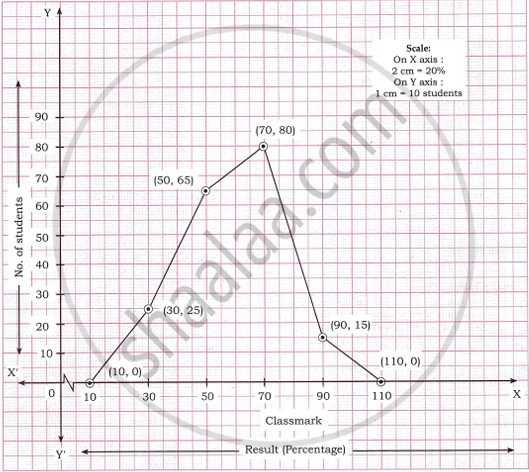
The following table shows the classification of percentage of marks of students and the number of students. Draw frequency polygon from the table without drawing histogram:
| Result (Percentage) | Number of Students |
| 20 - 40 | 25 |
| 40 - 60 | 65 |
| 60 - 80 | 80 |
| 80 - 100 | 15 |
उत्तर
| Result (Percentage) | Class Mark | Number of Students | Coordinates of points |
| 20 - 40 | 30 | 25 | (30, 25) |
| 40 - 60 | 50 | 65 | (50, 65) |
| 60 - 80 | 70 | 80 | (70, 80) |
| 80 - 100 | 90 | 15 | (90, 15) |

APPEARS IN
संबंधित प्रश्न
The marks scored by students in Mathematics in a certain Examination are given below:
| Marks Scored | Number of Students |
| 0 — 20 | 3 |
| 20 — 40 | 8 |
| 40 — 60 | 19 |
| 60 — 80 | 18 |
| 80 — 100 | 6 |
Draw histogram for the above data.
Find the correct answer from the alternatives given.
|
No. of trees planted by each student |
1 - 3 | 4 - 6 | 7 - 9 | 10 - 12 |
| No. of students | 7 | 8 | 6 | 4 |
The above data is to be shown by a frequency polygon. The coordinates of the points to show number of students in the class 4-6 are . . . .
The following histogram shows the frequency distribution f the ages of 22 teachers in a school:
(i) What is the number of eldest and youngest teachers in the school?
(ii) Which age group teachers are more in the school and which least?
(iii) What is the size of the classes?
(iv) What are the class marks of the classes?
Draw histogram and hence the frequency polygon for the following frequency distribution:
| Rainfall (in cm) | No. of years |
| 20-25 | 2 |
| 25-30 | 5 |
| 30-35 | 8 |
| 35-40 | 12 |
| 40-45 | 10 |
| 45-50 | 7 |
A graph that displays data that changes continuously over the periods of time is _________
Form a continuous frequency distribution table and draw histogram from the following data.
| Age (in years) | No. of persons |
| Under 5 | 1 |
| Under 10 | 12 |
| Under 15 | 19 |
| Under 20 | 26 |
| Under 25 | 27 |
| Under 30 | 35 |
| Under 35 | 38 |
| Under 40 | 45 |
| Under 45 | 48 |
| Under 50 | 53 |
Draw a histogram for the following data.
| Mid Value (x) | 15 | 25 | 35 | 45 | 55 | 65 | 75 |
| Frequency (f) | 12 | 24 | 30 | 18 | 26 | 10 | 8 |
Try yourself
- Next time when you watch your favourite TV programme, count the number of advertisements during each break. Use tally marks. Put a dot below the tally when you find children in any advertisement.
- Compare with your friends. Do you get different answers?
Draw a histogram to represent the frequency distribution in question 91.
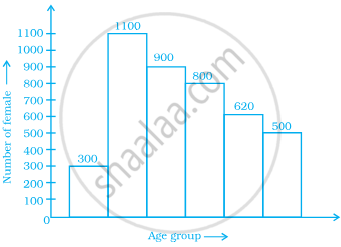
The below histogram shows the number of literate females in the age group of 10 to 40 years in a town.

- Write the classes assuming all the classes are of equal width.
- What is the classes width?
- In which age group are literate females the least?
- In which age group is the number of literate females the highest?
