Advertisements
Advertisements
प्रश्न
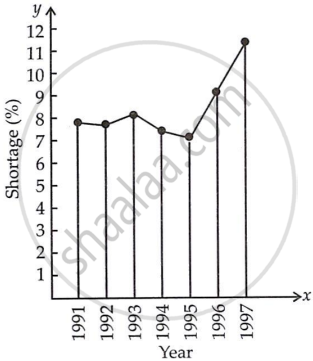
The following Table shows the total power shortage in India from 1991 − 1997. Show the data in the form of a graph. Plot shortage percentage for the years on the Y-axis and the year on the X-axis.
| S. No | Year | Shortage (%) |
| 1 | 1991 | 7.9 |
| 2 | 1992 | 7.8 |
| 3 | 1993 | 8.3 |
| 4 | 1994 | 7.4 |
| 5 | 1995 | 7.1 |
| 6 | 1996 | 9.2 |
| 7 | 1997 | 11.5 |
आलेख
उत्तर
Scale: Along the x-axis: 1 unit = 1 year
Along the y-axis: 1 unit = 1%
shaalaa.com
Some Natural Resources Are Limited
या प्रश्नात किंवा उत्तरात काही त्रुटी आहे का?
